AI that carries the deal.
Each deal, coverage list and portfolio gets its own project. Capital Intuition keeps the work current, builds the apps your team needs and runs in your firm's own cloud.
Projects
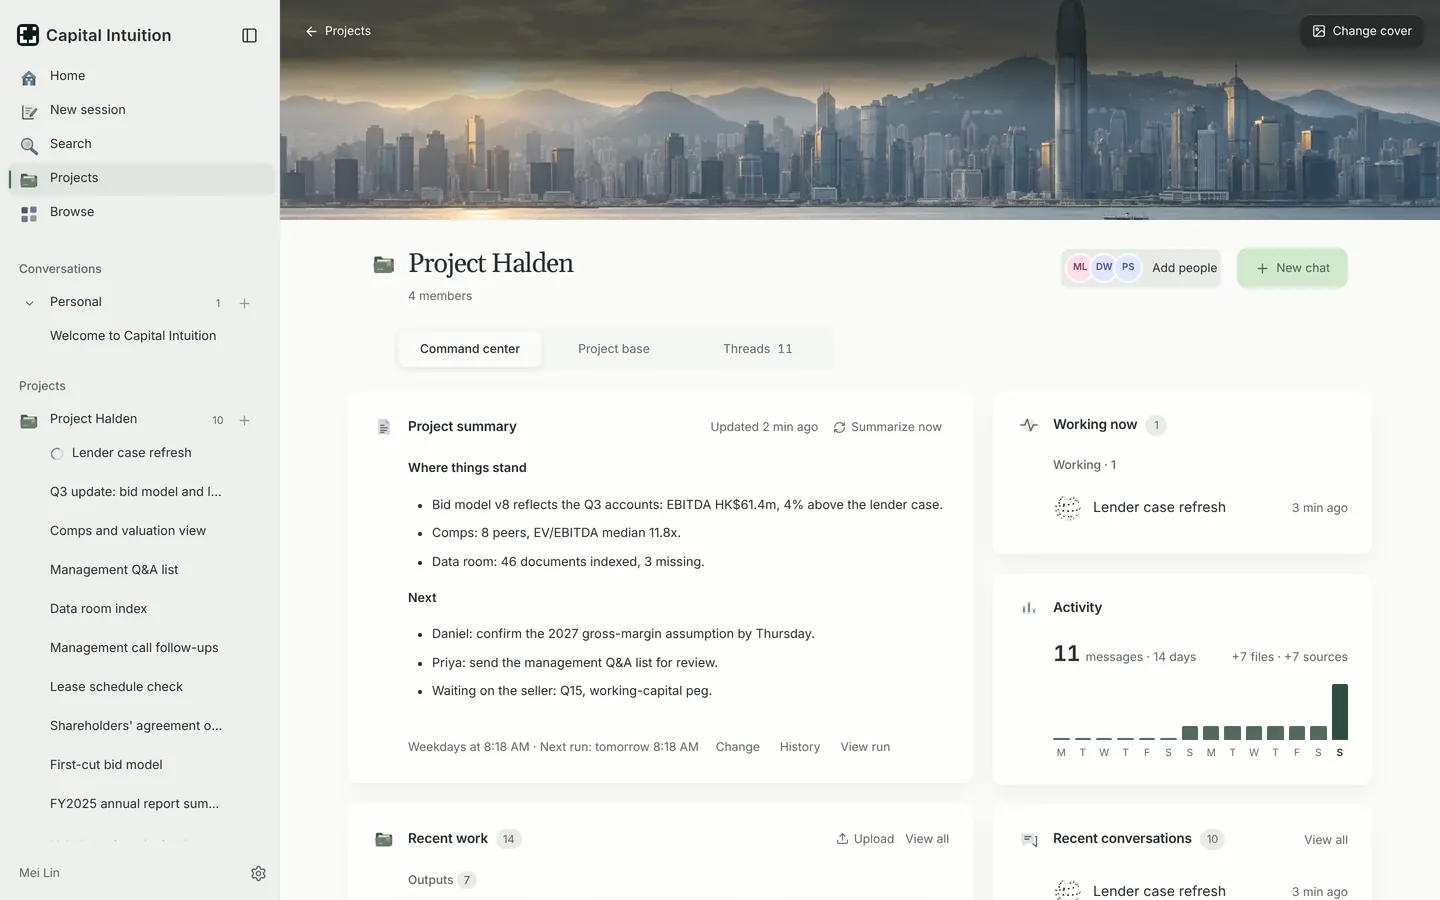
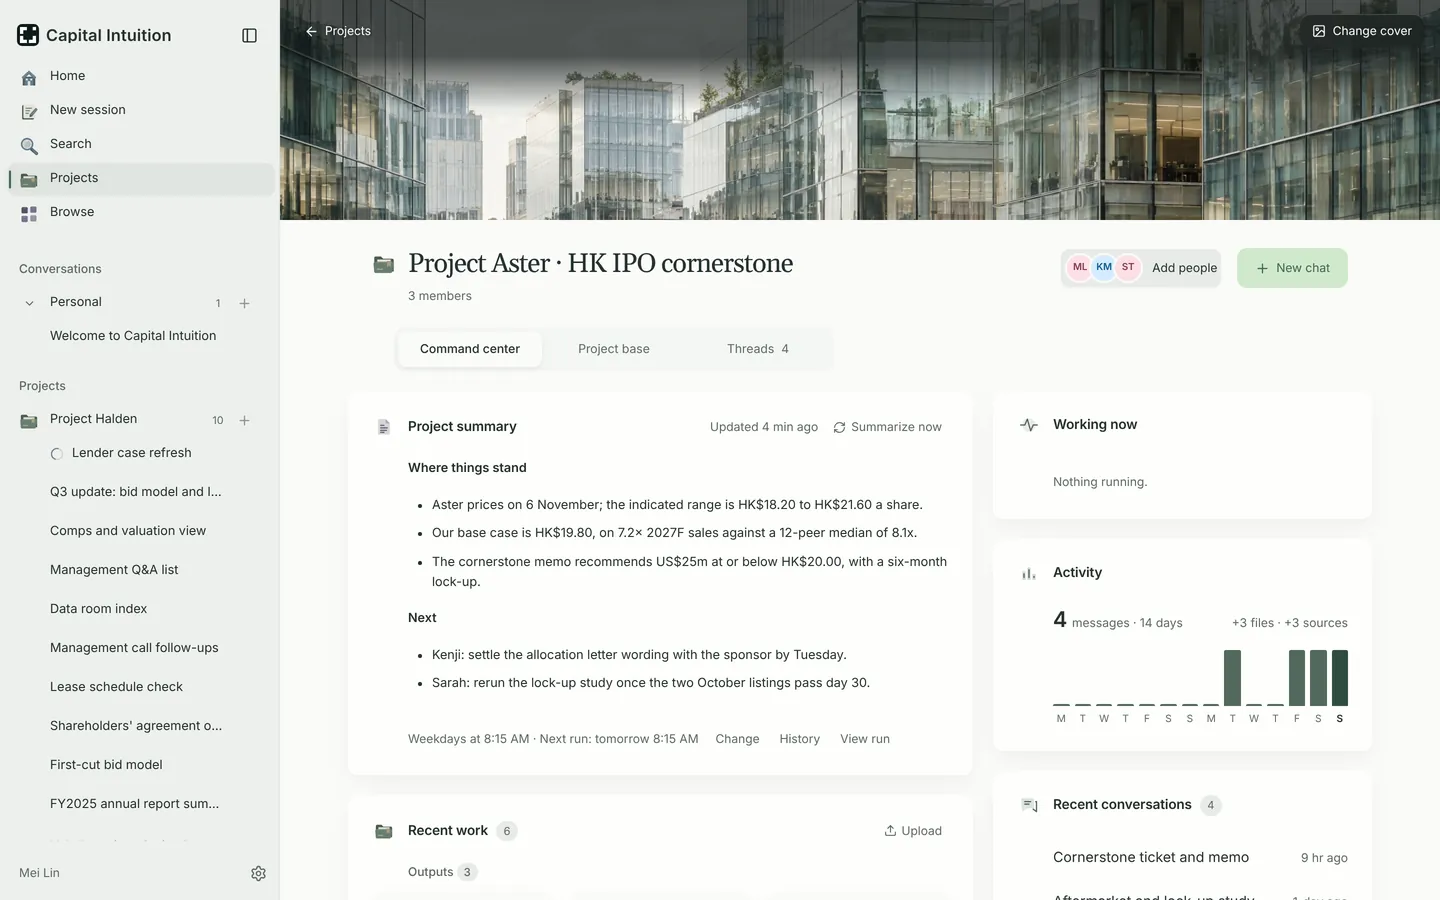
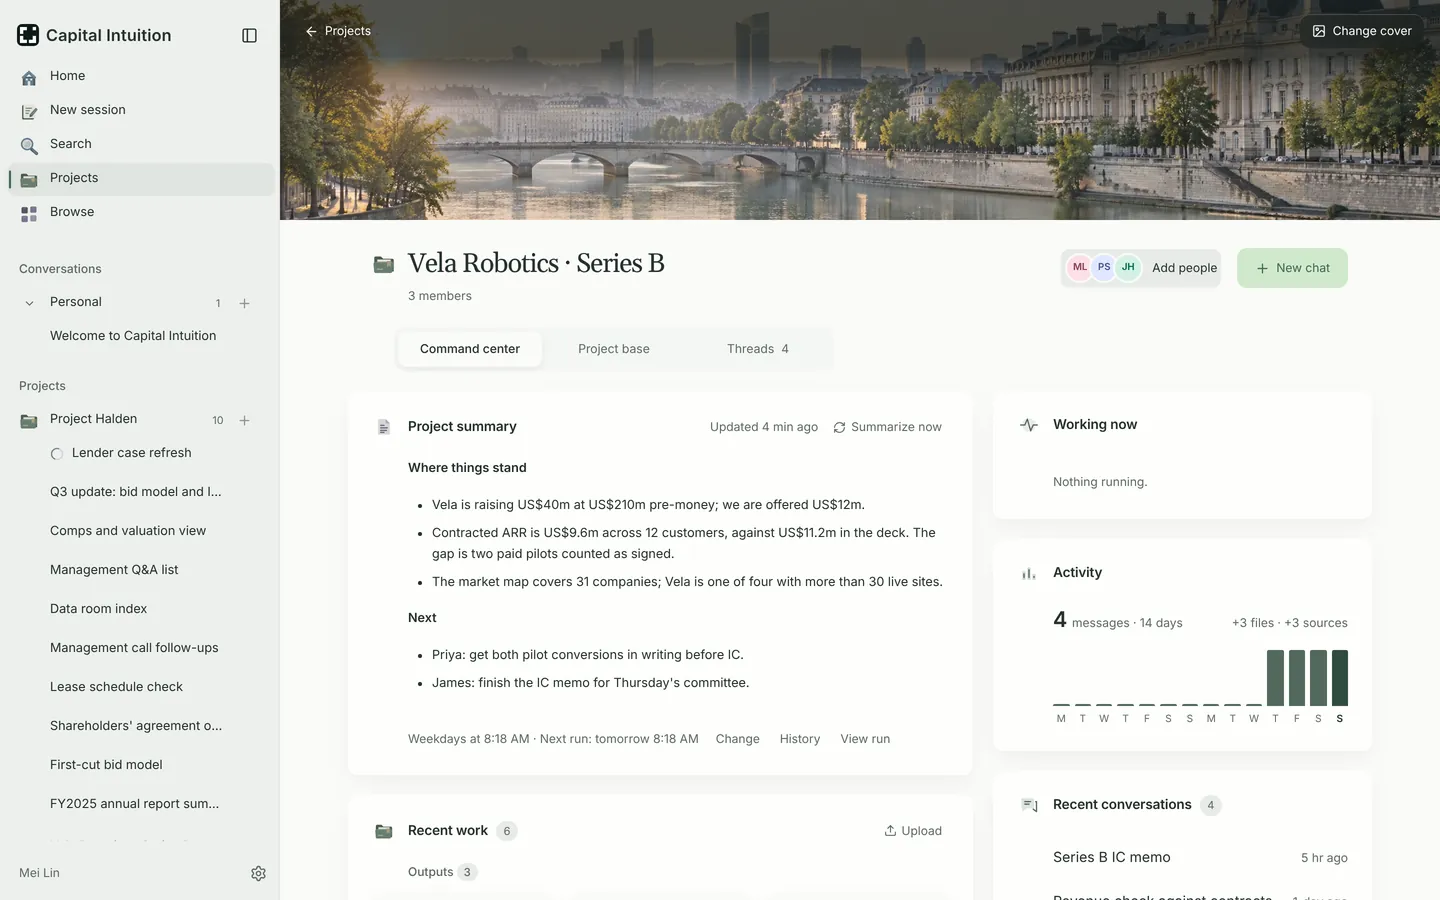
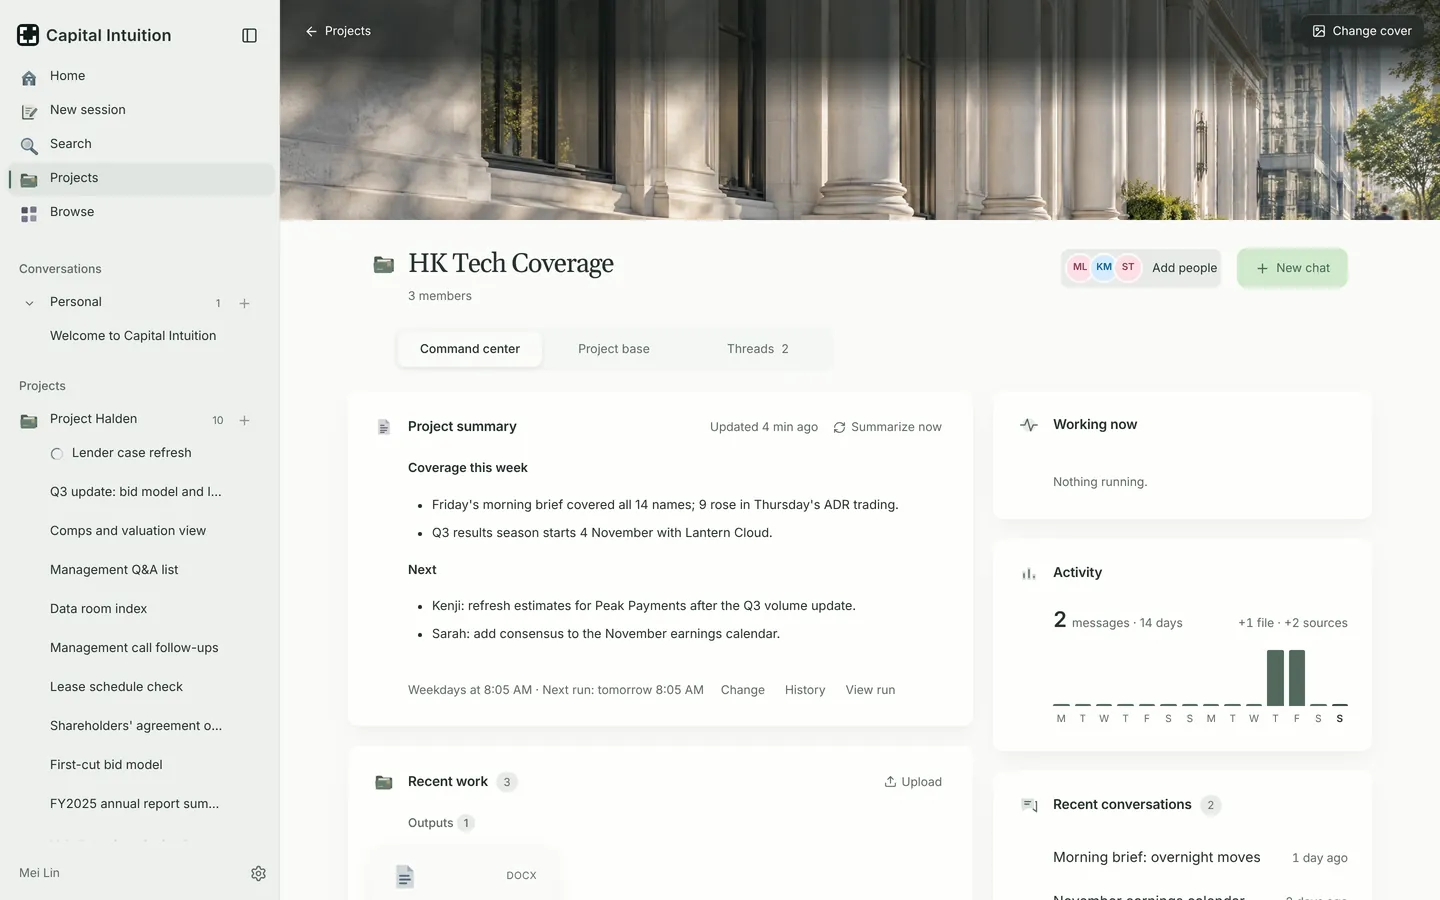
Every deal gets a home: the evidence, the work and the decisions, kept current as the deal moves.
How a project works → 02Apps
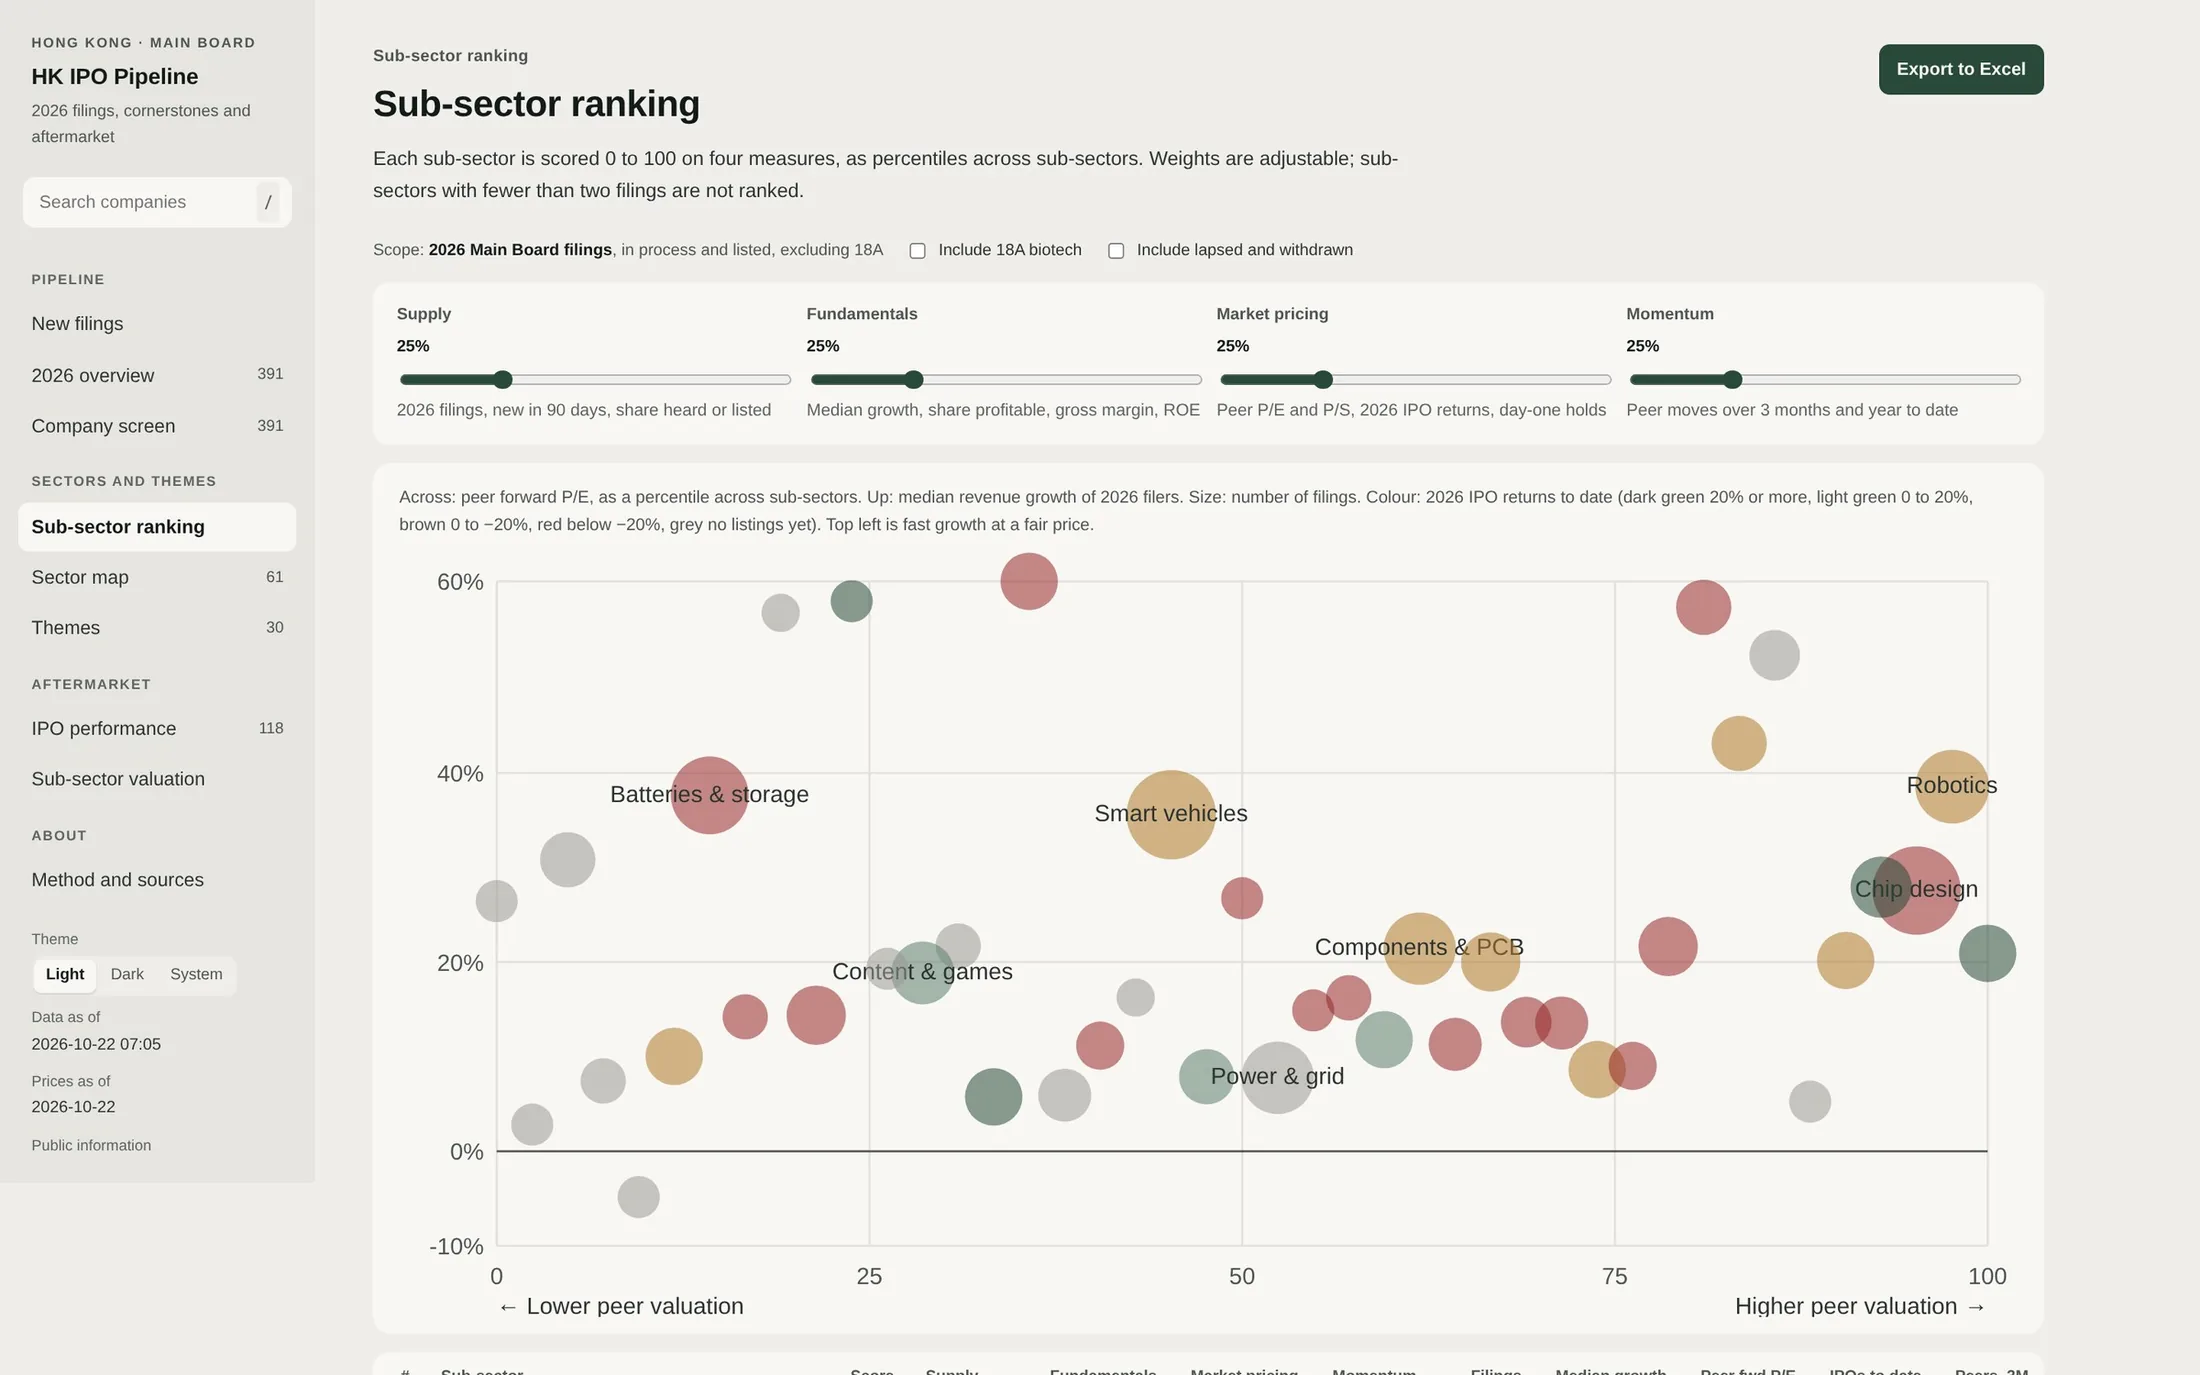
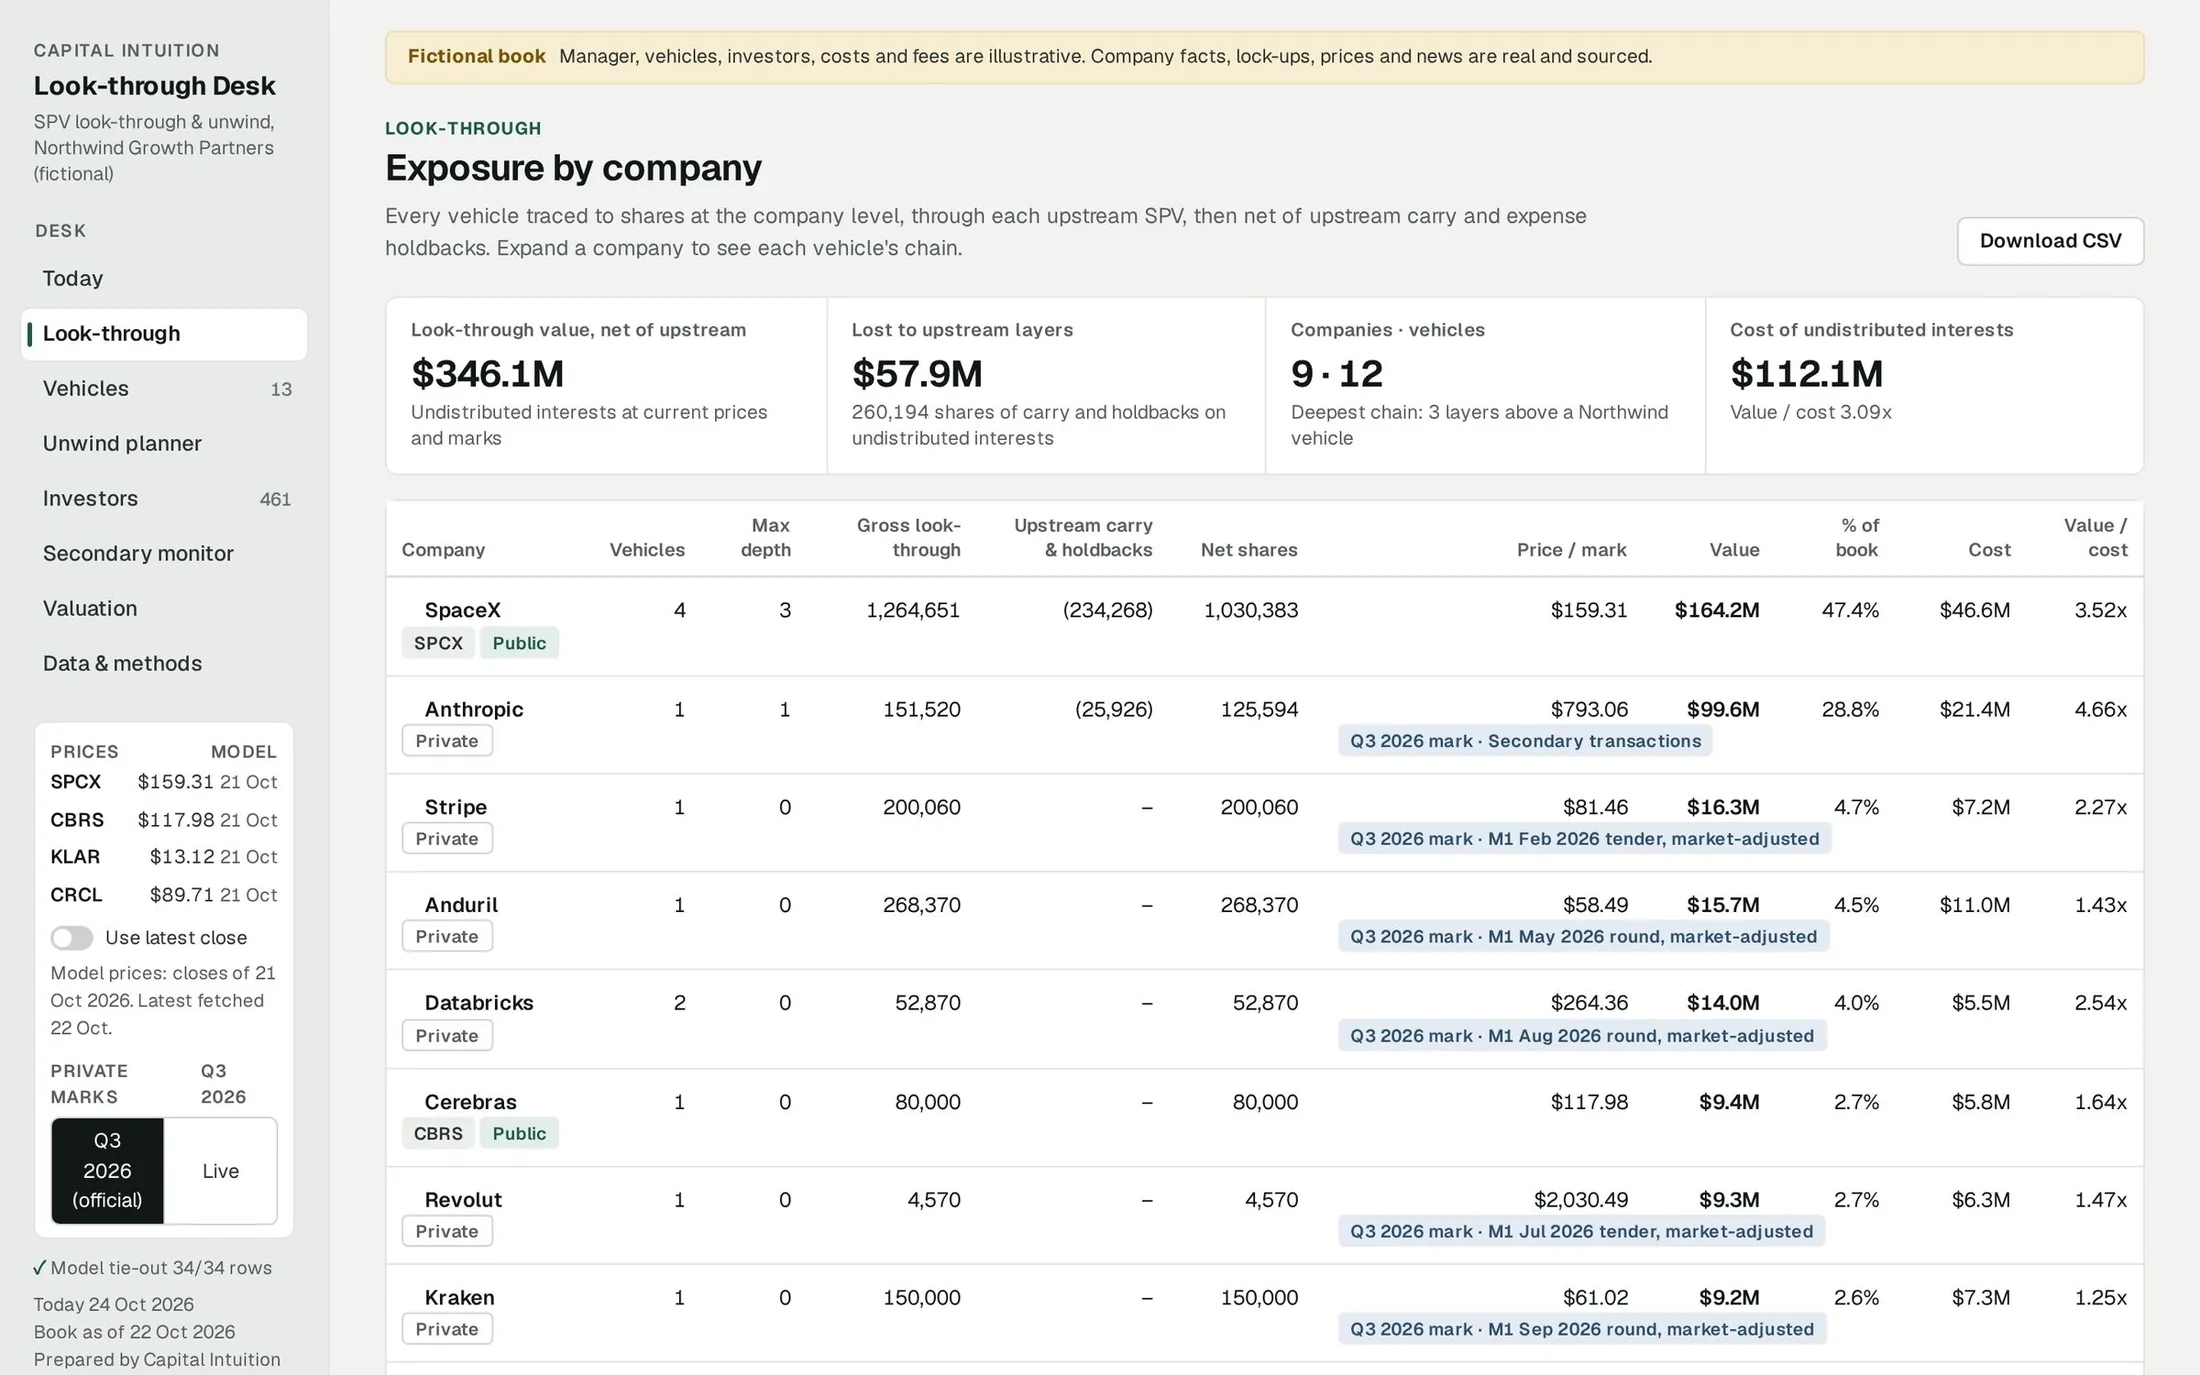
Ask for a desk, a watcher or a dashboard. It is built inside the project and keeps running.
See the apps → 03Your own cloud
Each firm runs in its own isolated cell.
Your projects, memory, skills and apps live there, so every new deal starts from what your firm already knows.
Each deal gets a home.
A project holds the whole deal and keeps it current. Every chat, teammate and agent starts with all of it in view.
- 01 · Evidence
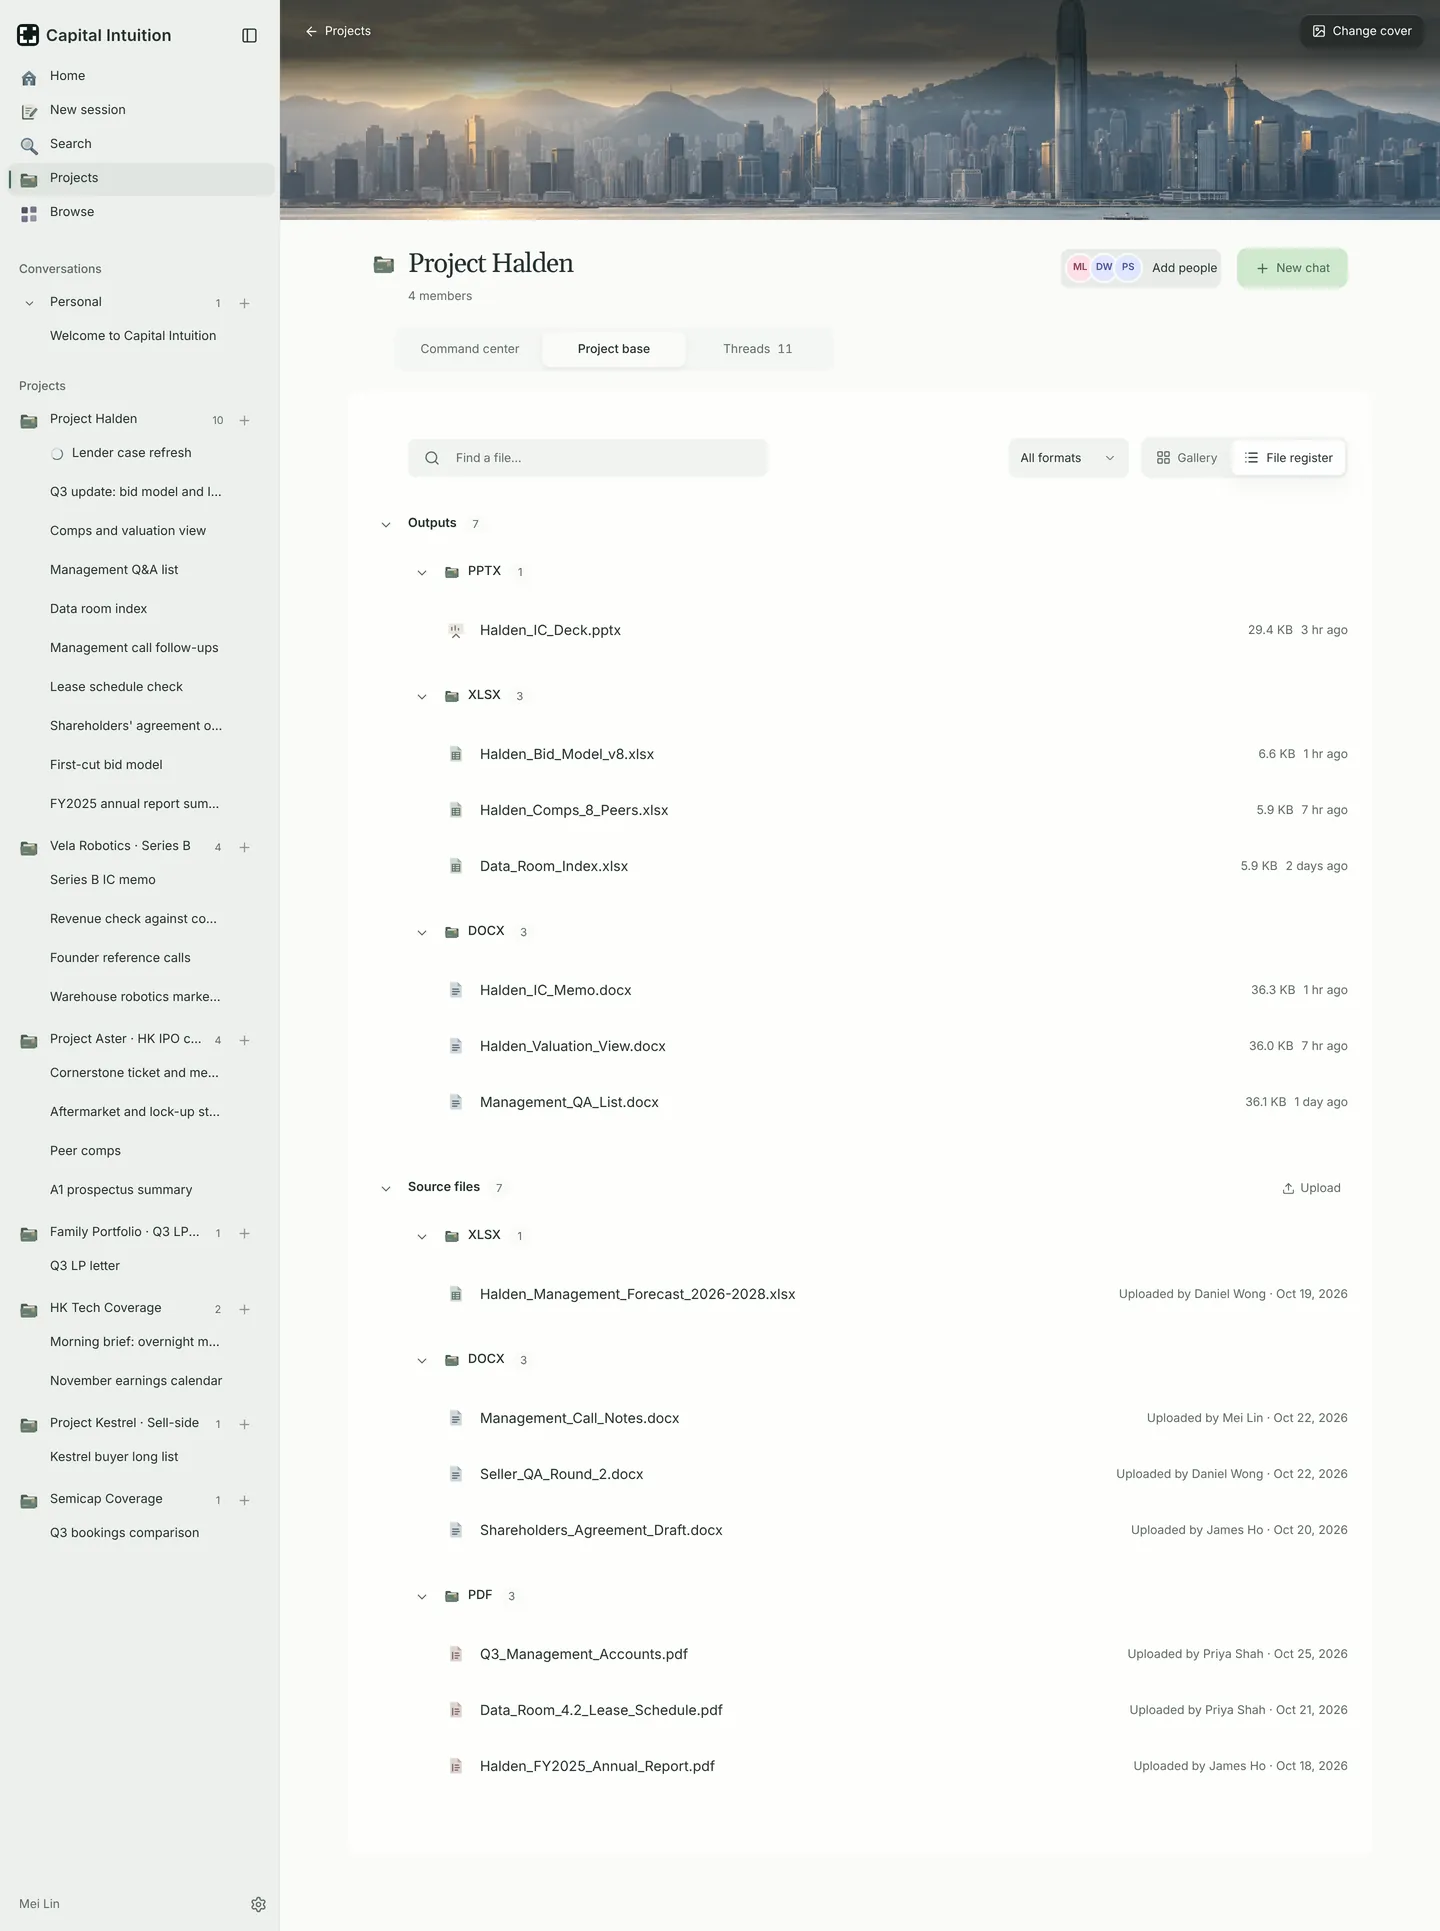
The data room, in one place.
Filings, data-room exports, accounts and call notes sit in the project, next to everything made from them.
- 02 · Agent work
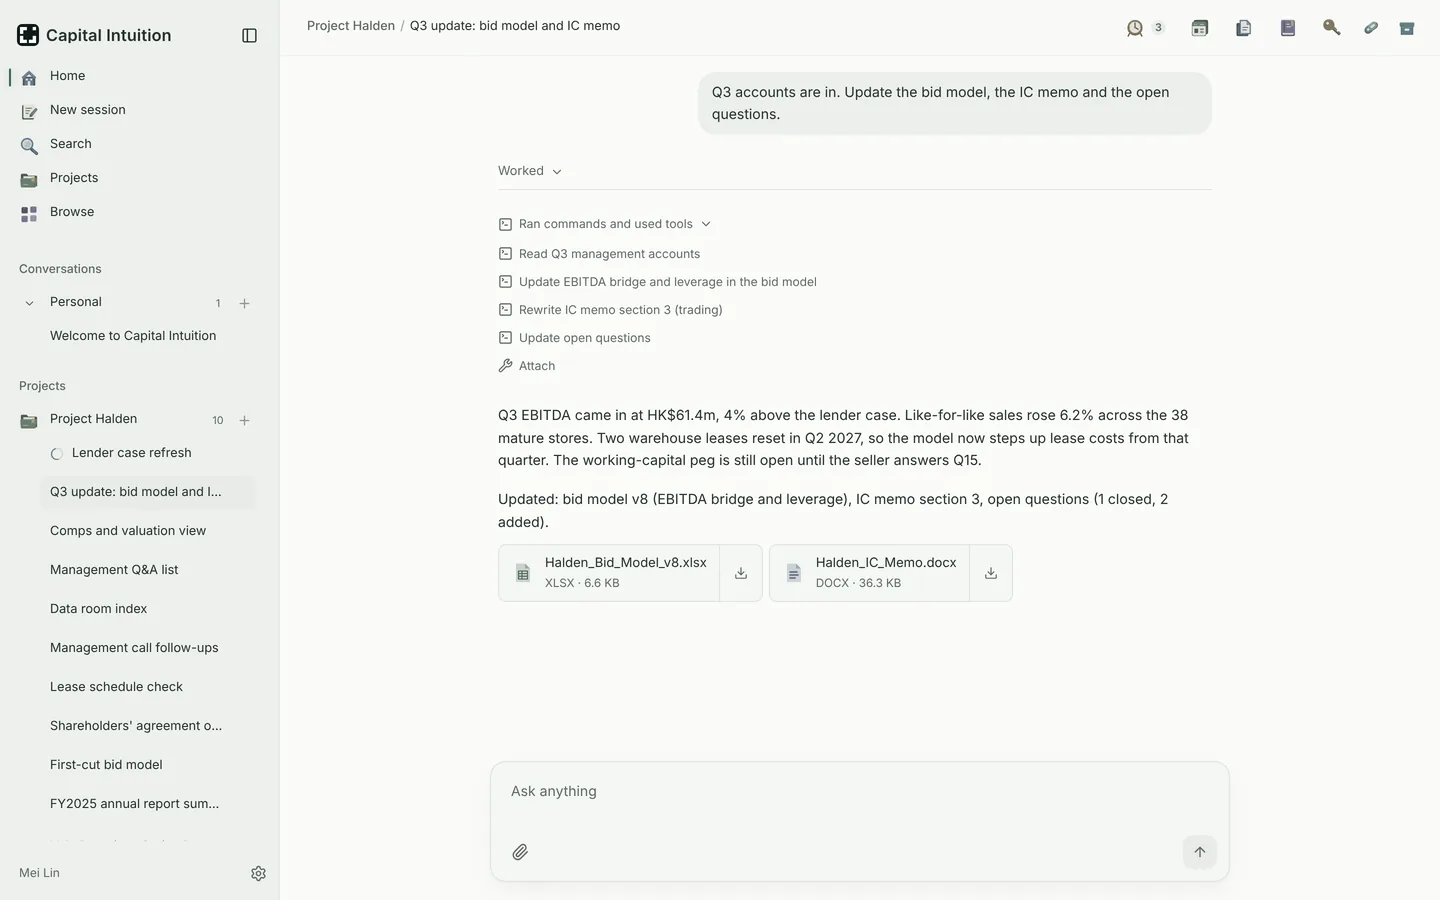
New numbers in. The work updates.
The Q3 accounts arrive. The agent updates the bid model, rewrites the memo and adjusts the open questions.
- 03 · Project status
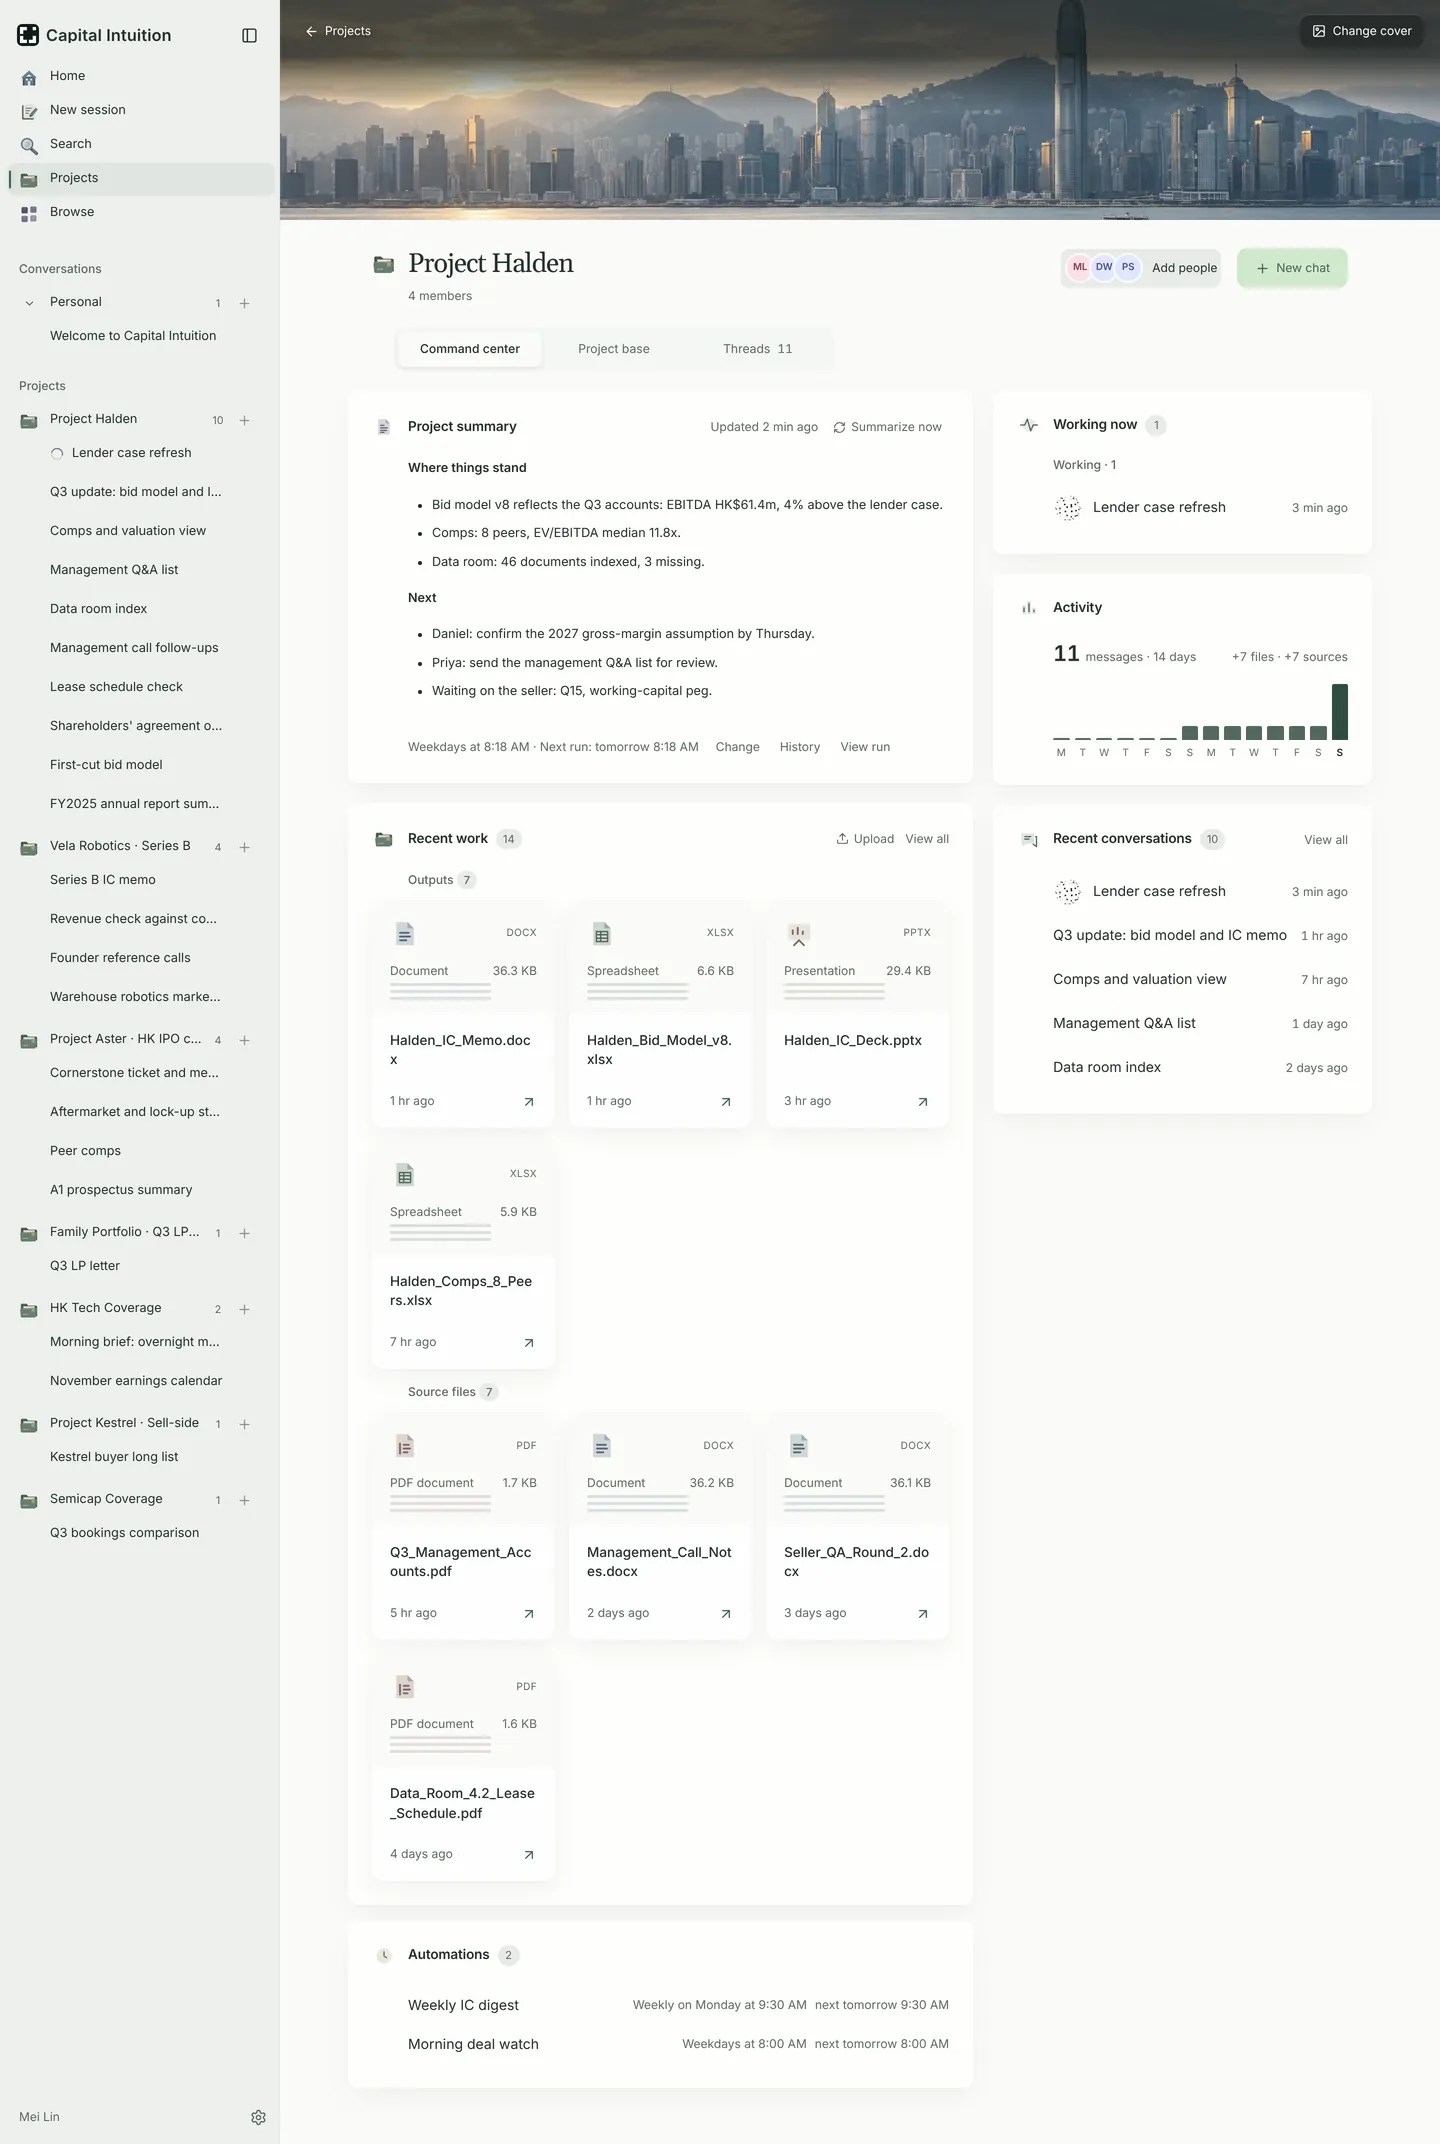
Where the deal stands, at a glance.
The project writes its own summary on a schedule: what changed, who owes what and what is still open.
- 04 · Outputs
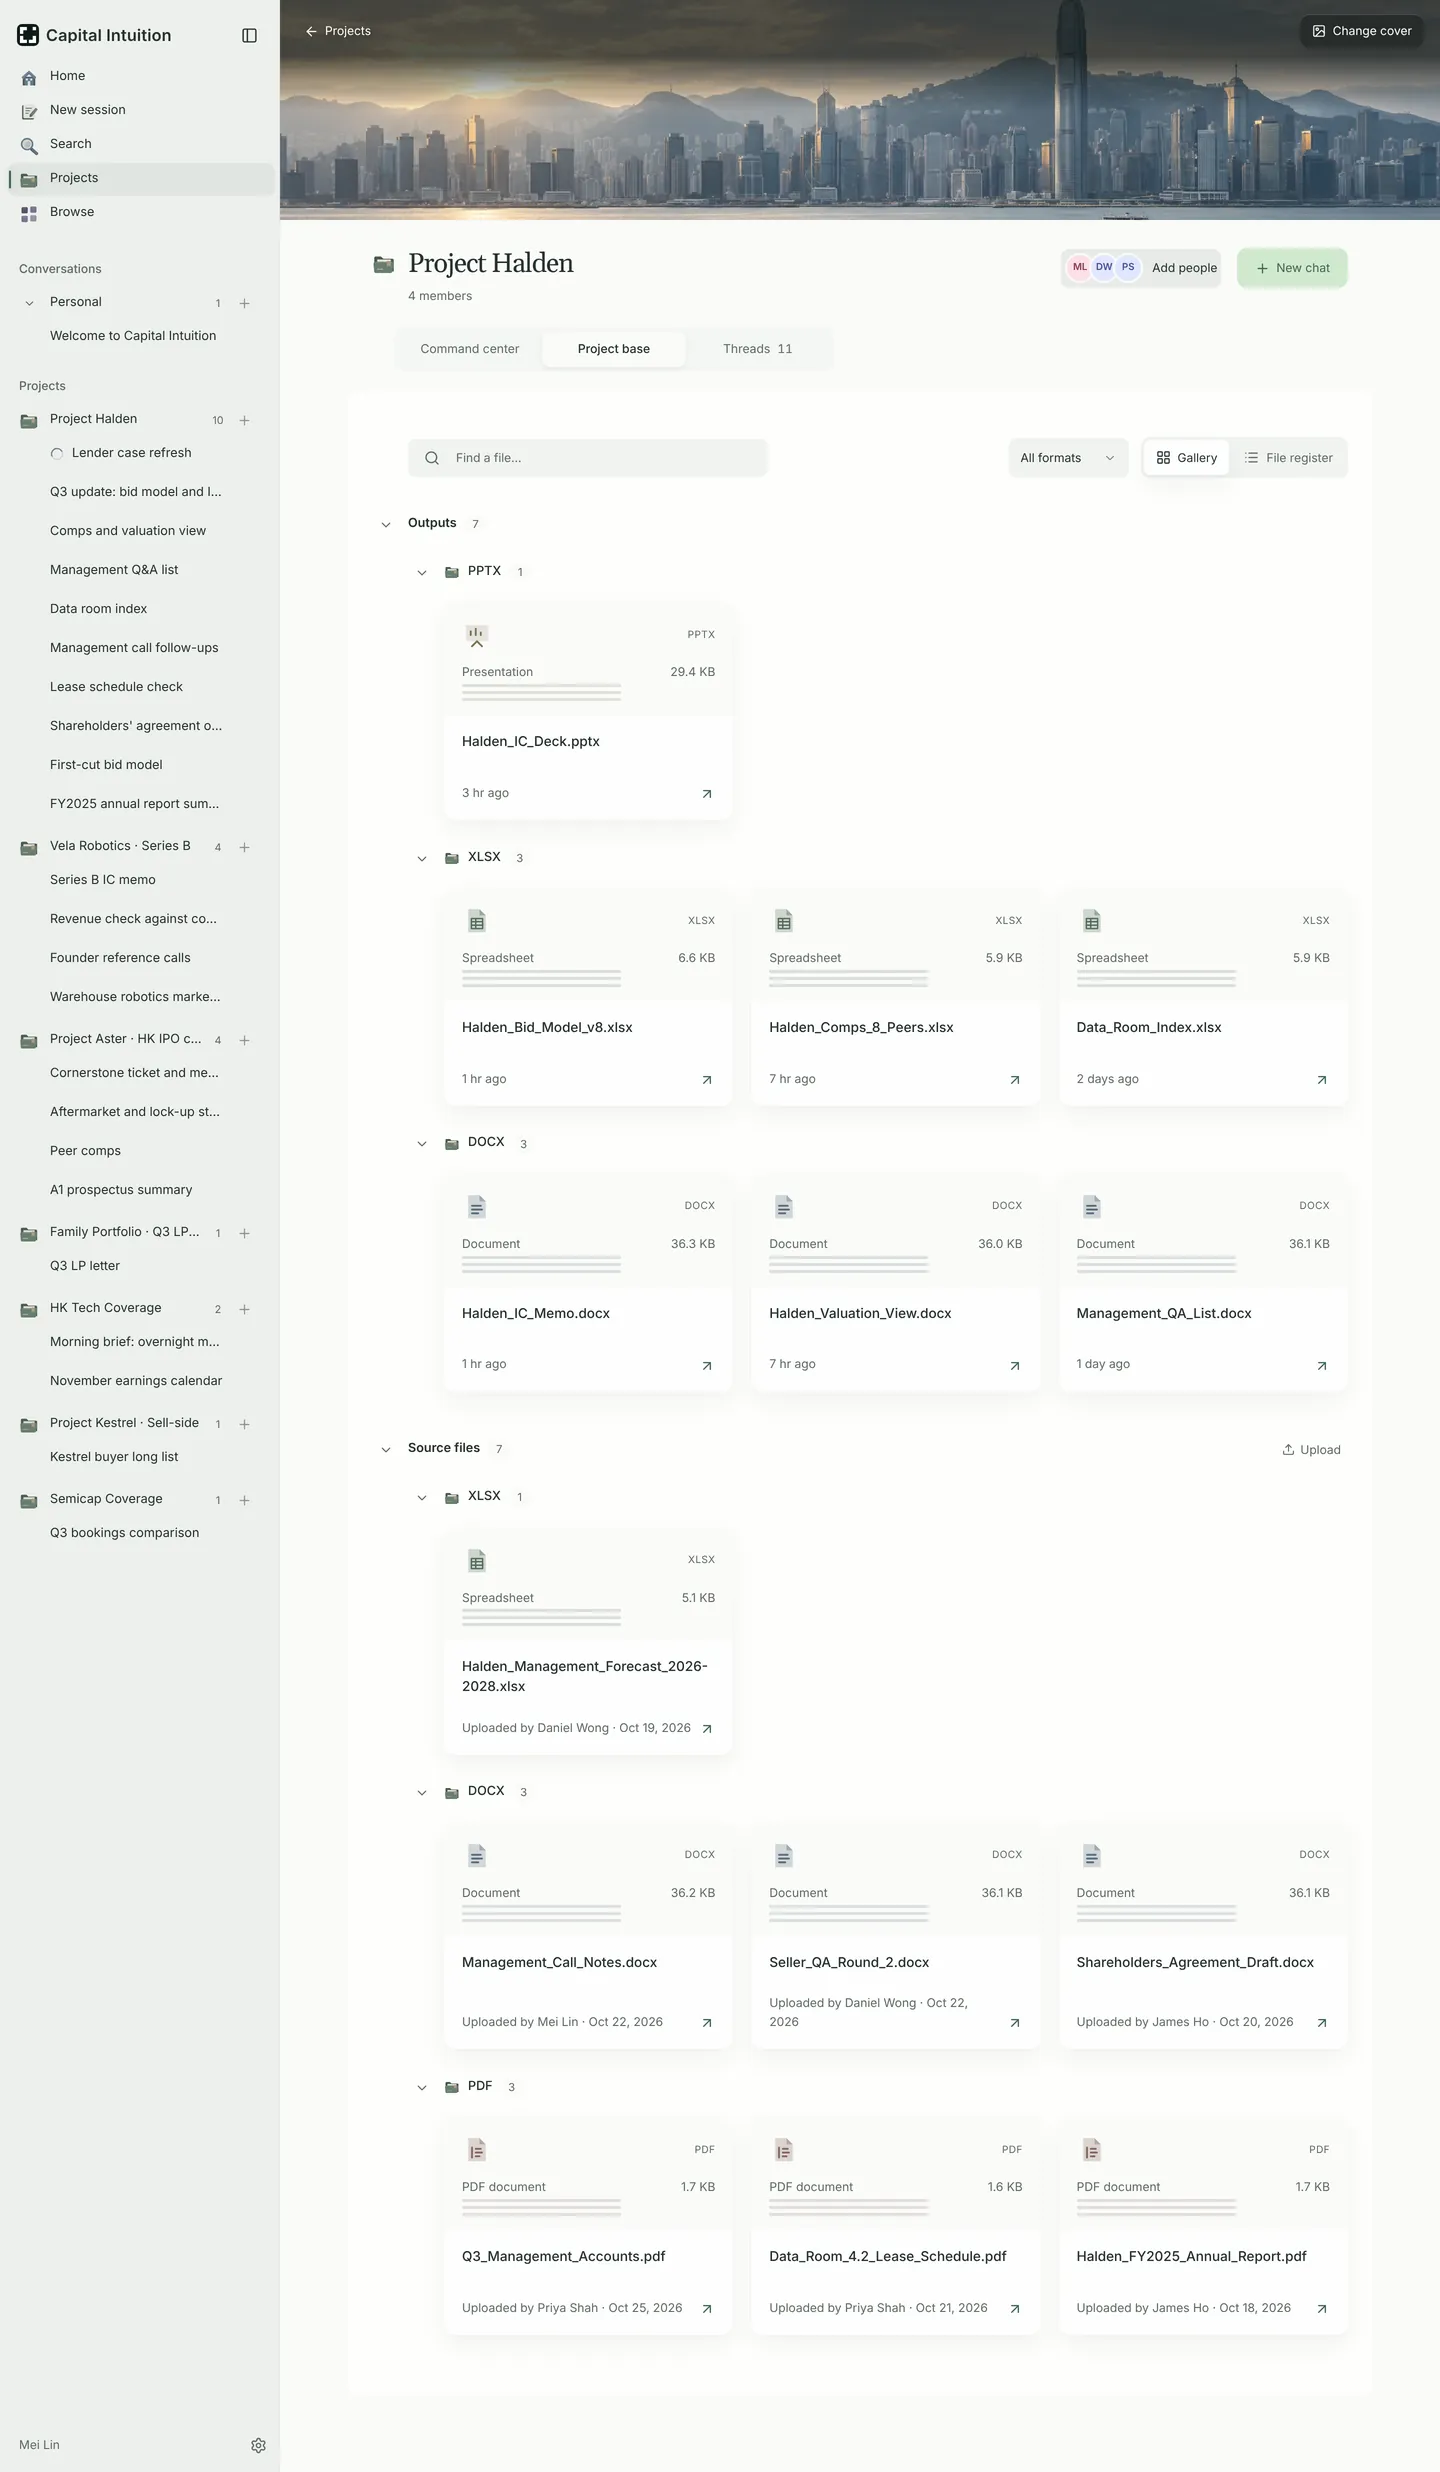
The finished work, kept with the deal.
Bid models, IC decks and memos are saved in the project, next to the sources they were built from.
Work in the formats you sign off.
Native Excel,
live formulas
Workbooks built the way a deal team builds them: blue inputs, linked build-ups and a checks tab. Change an assumption and the model moves.
Decks that hold up
in committee
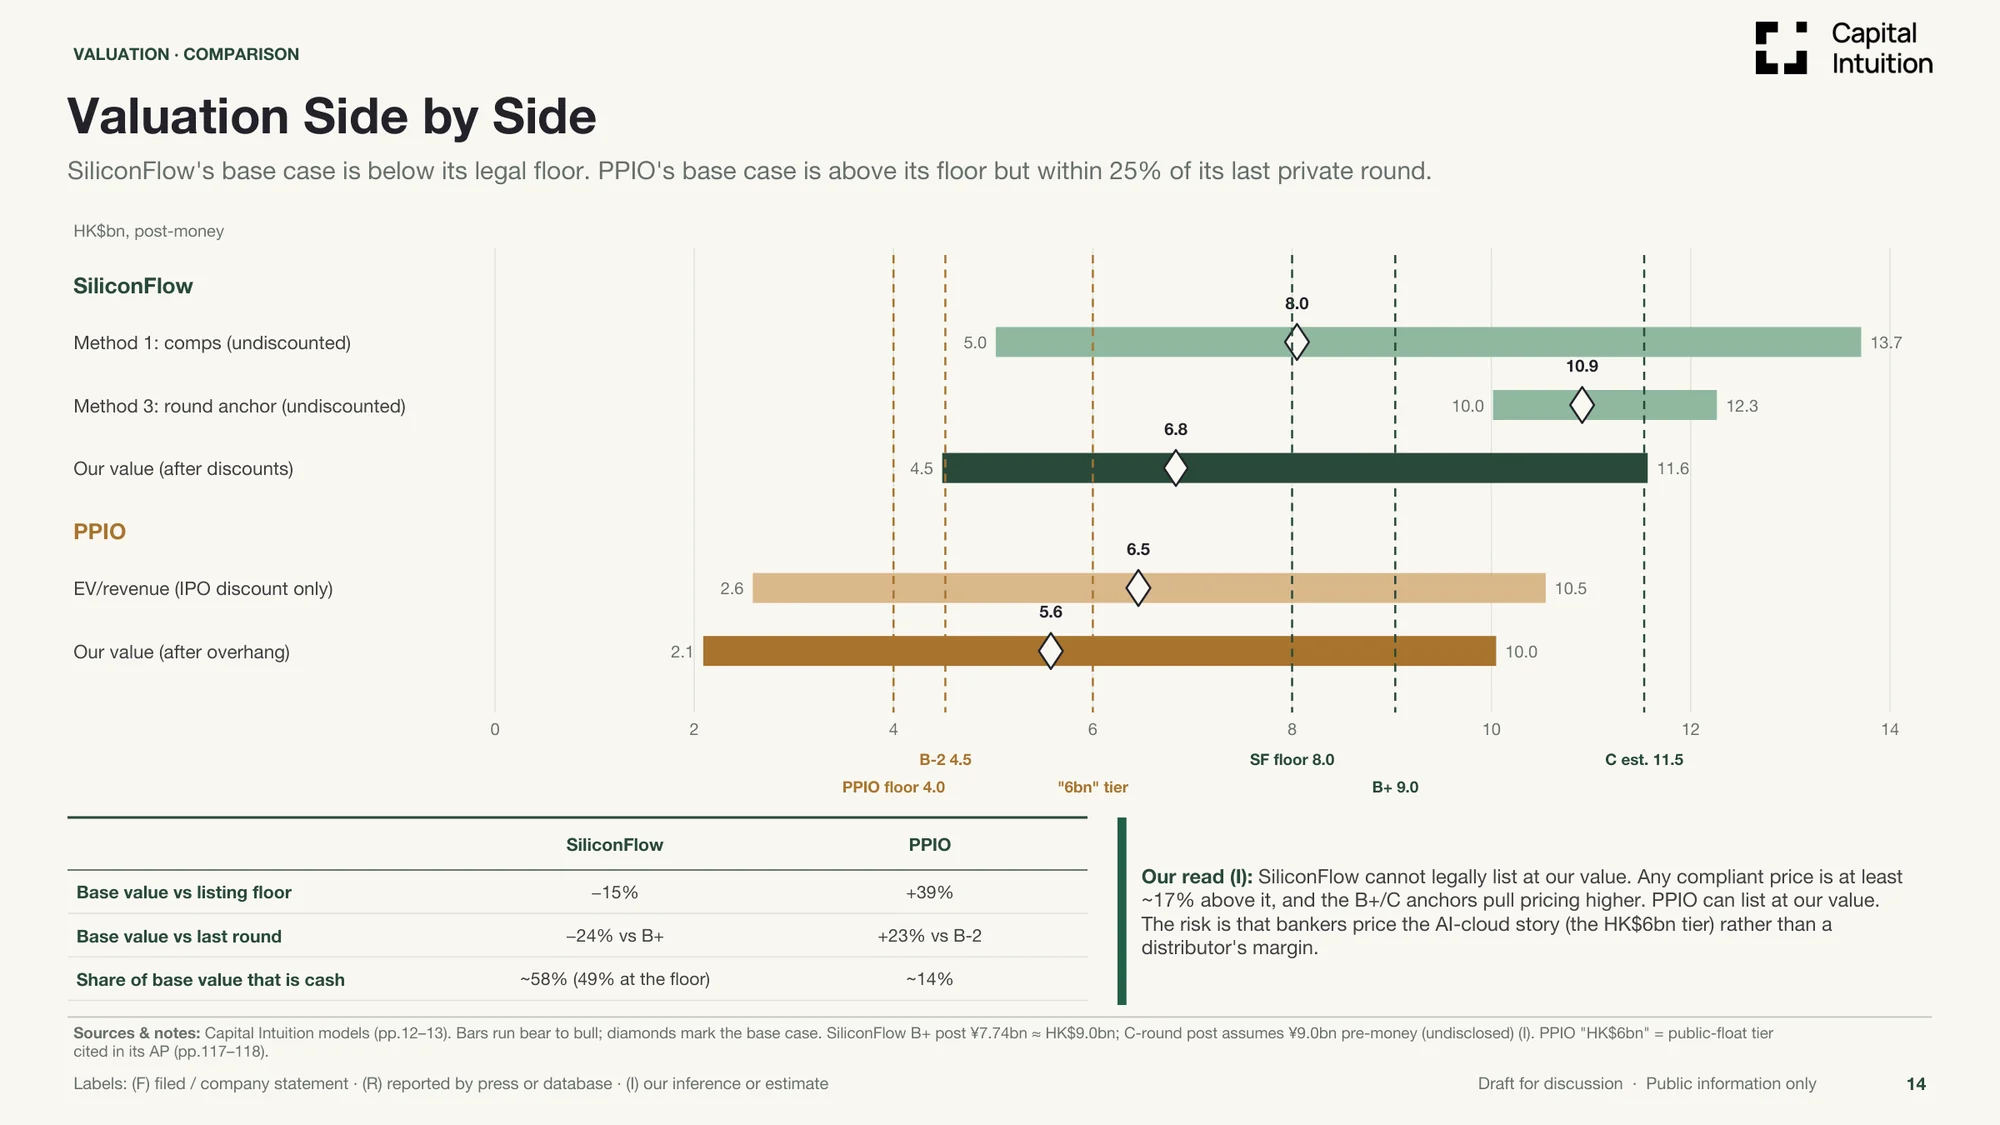
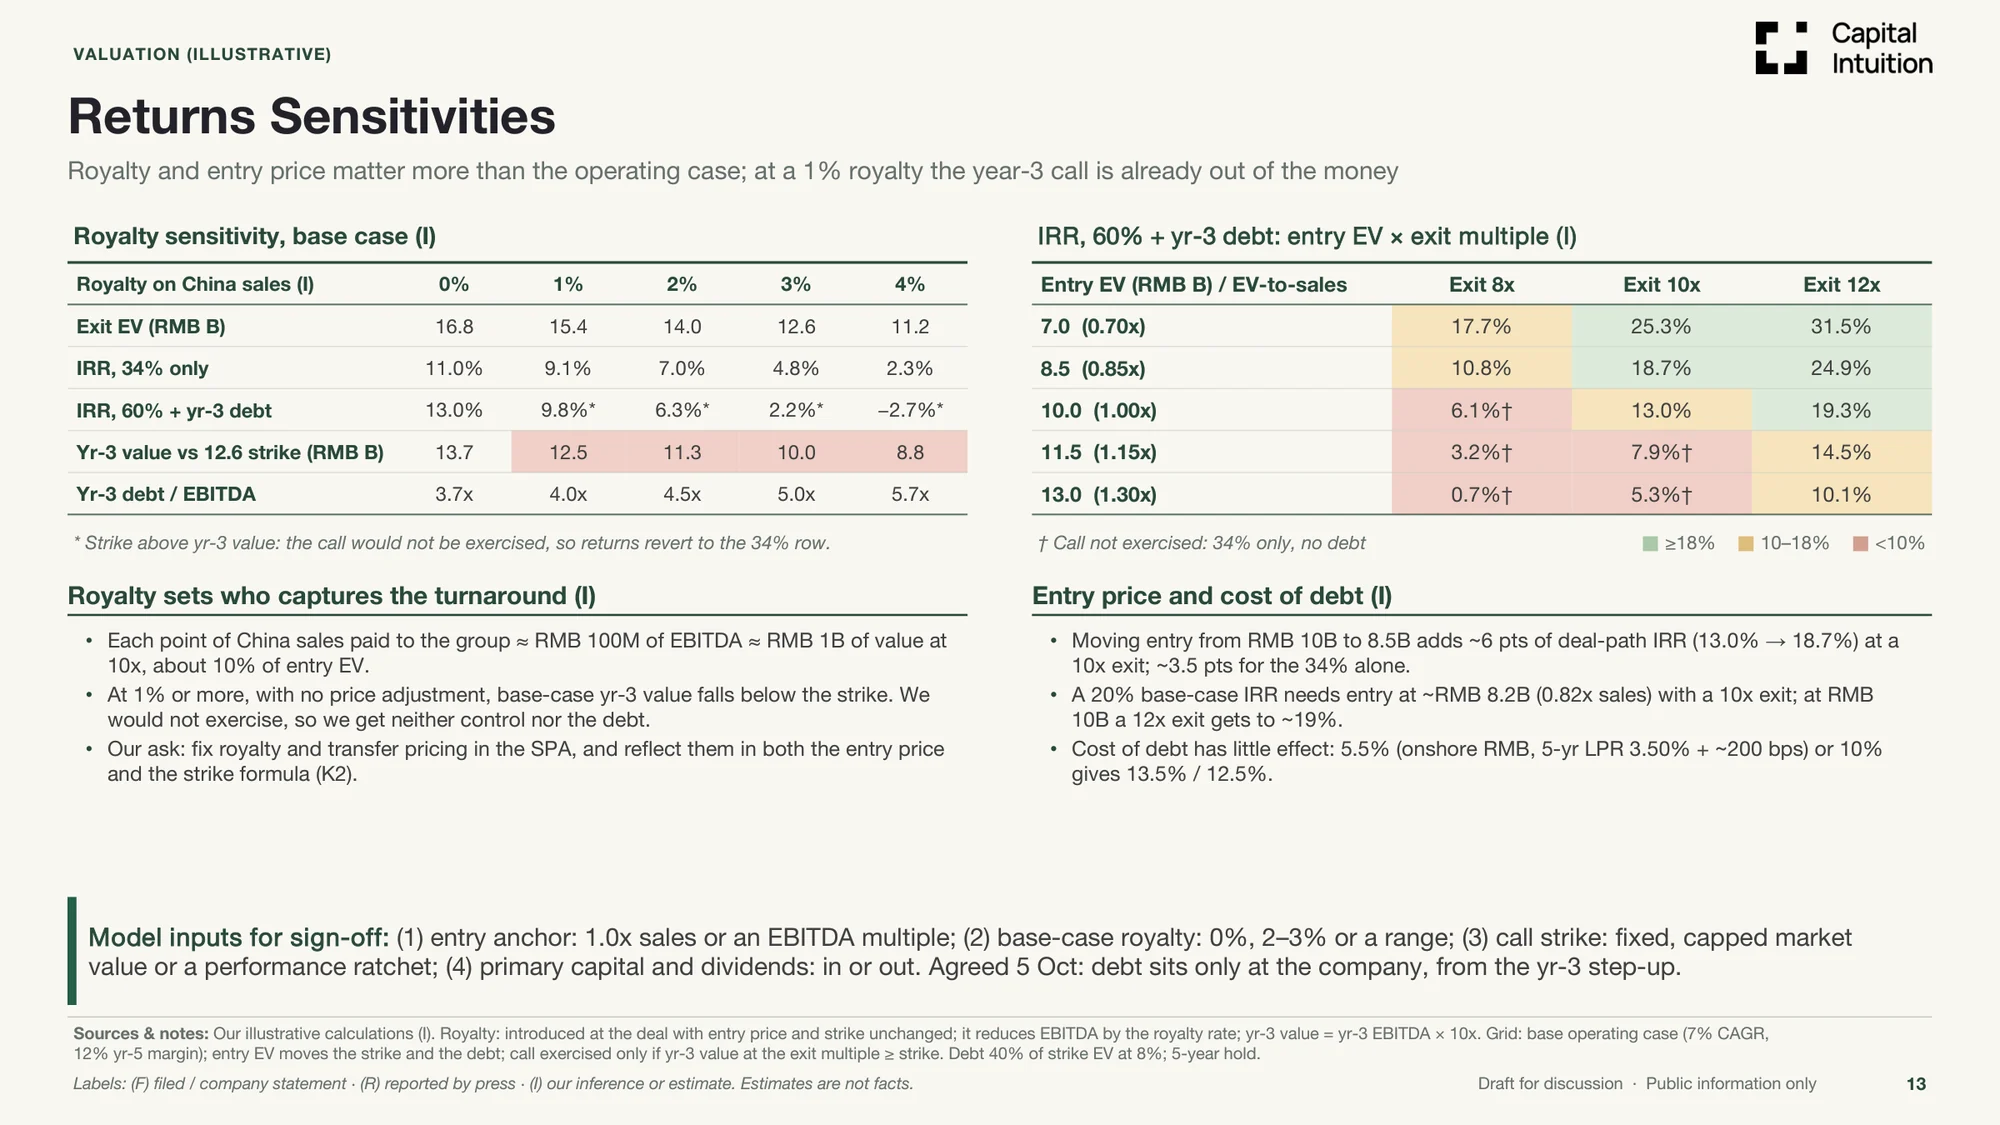
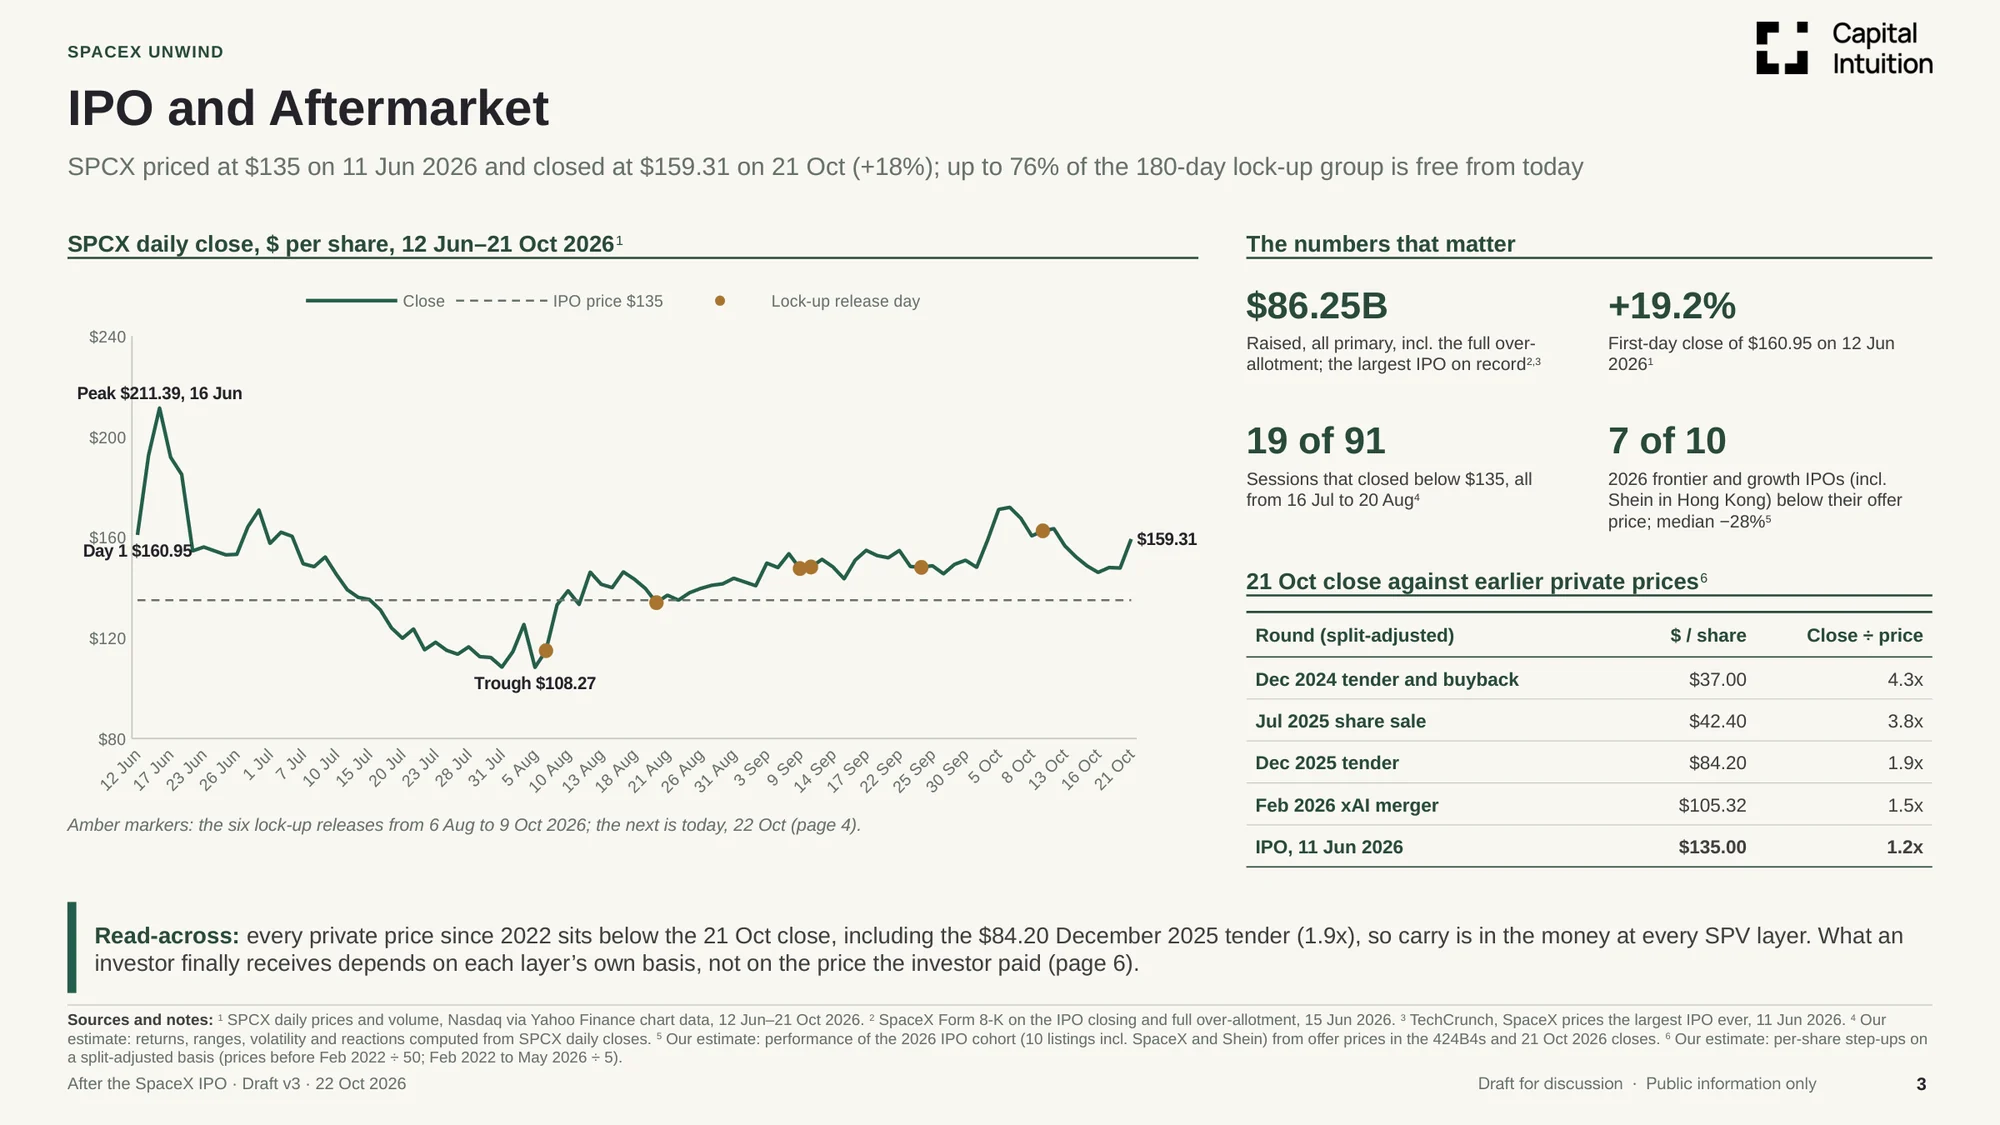
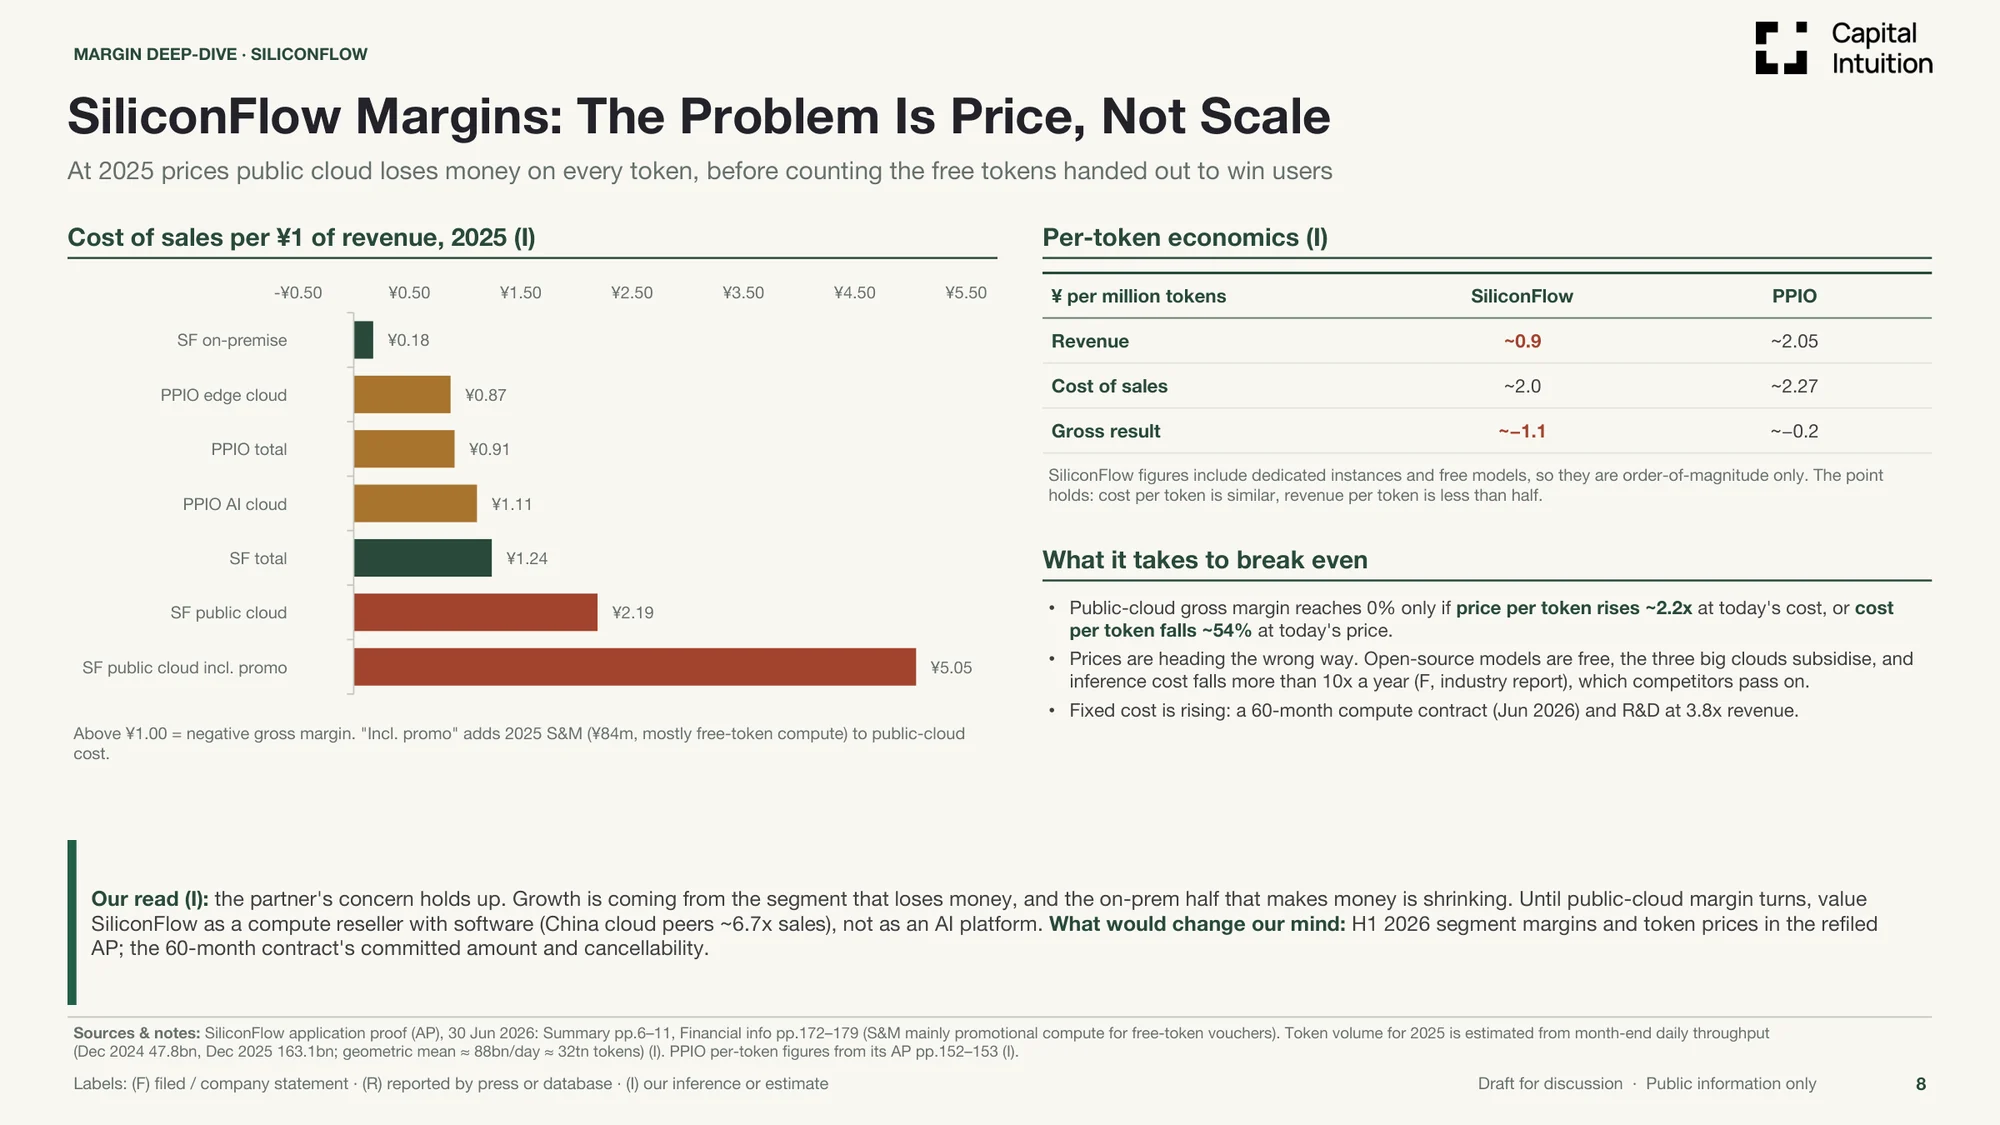
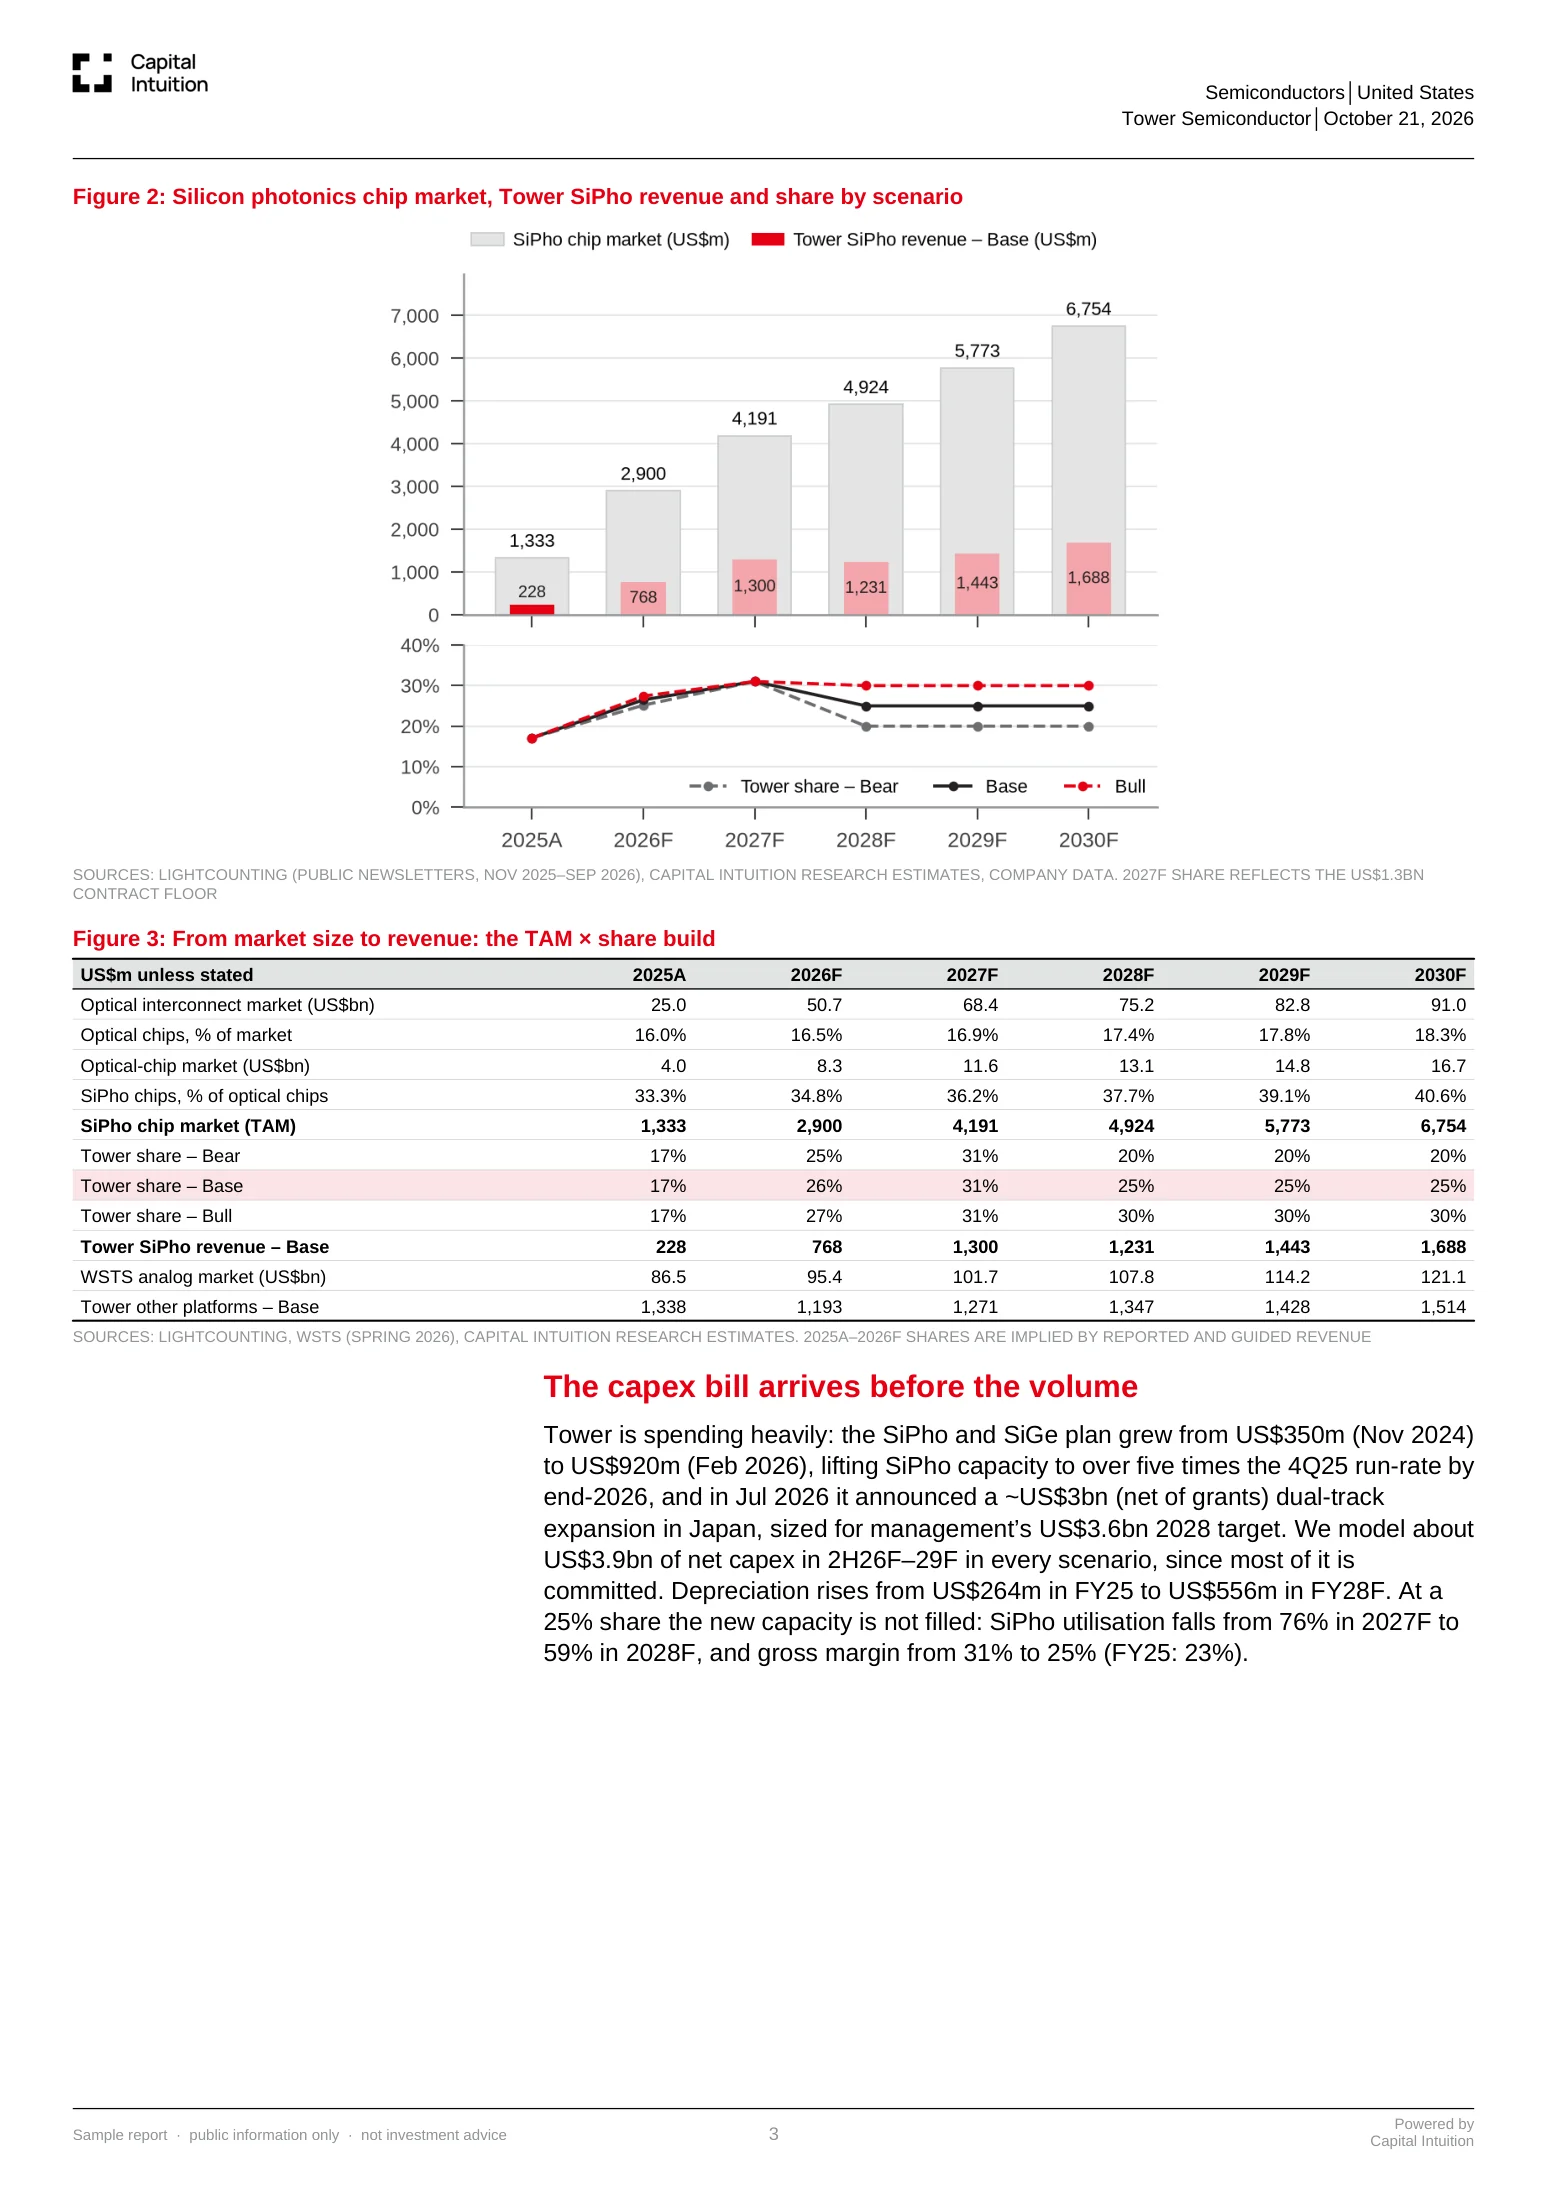
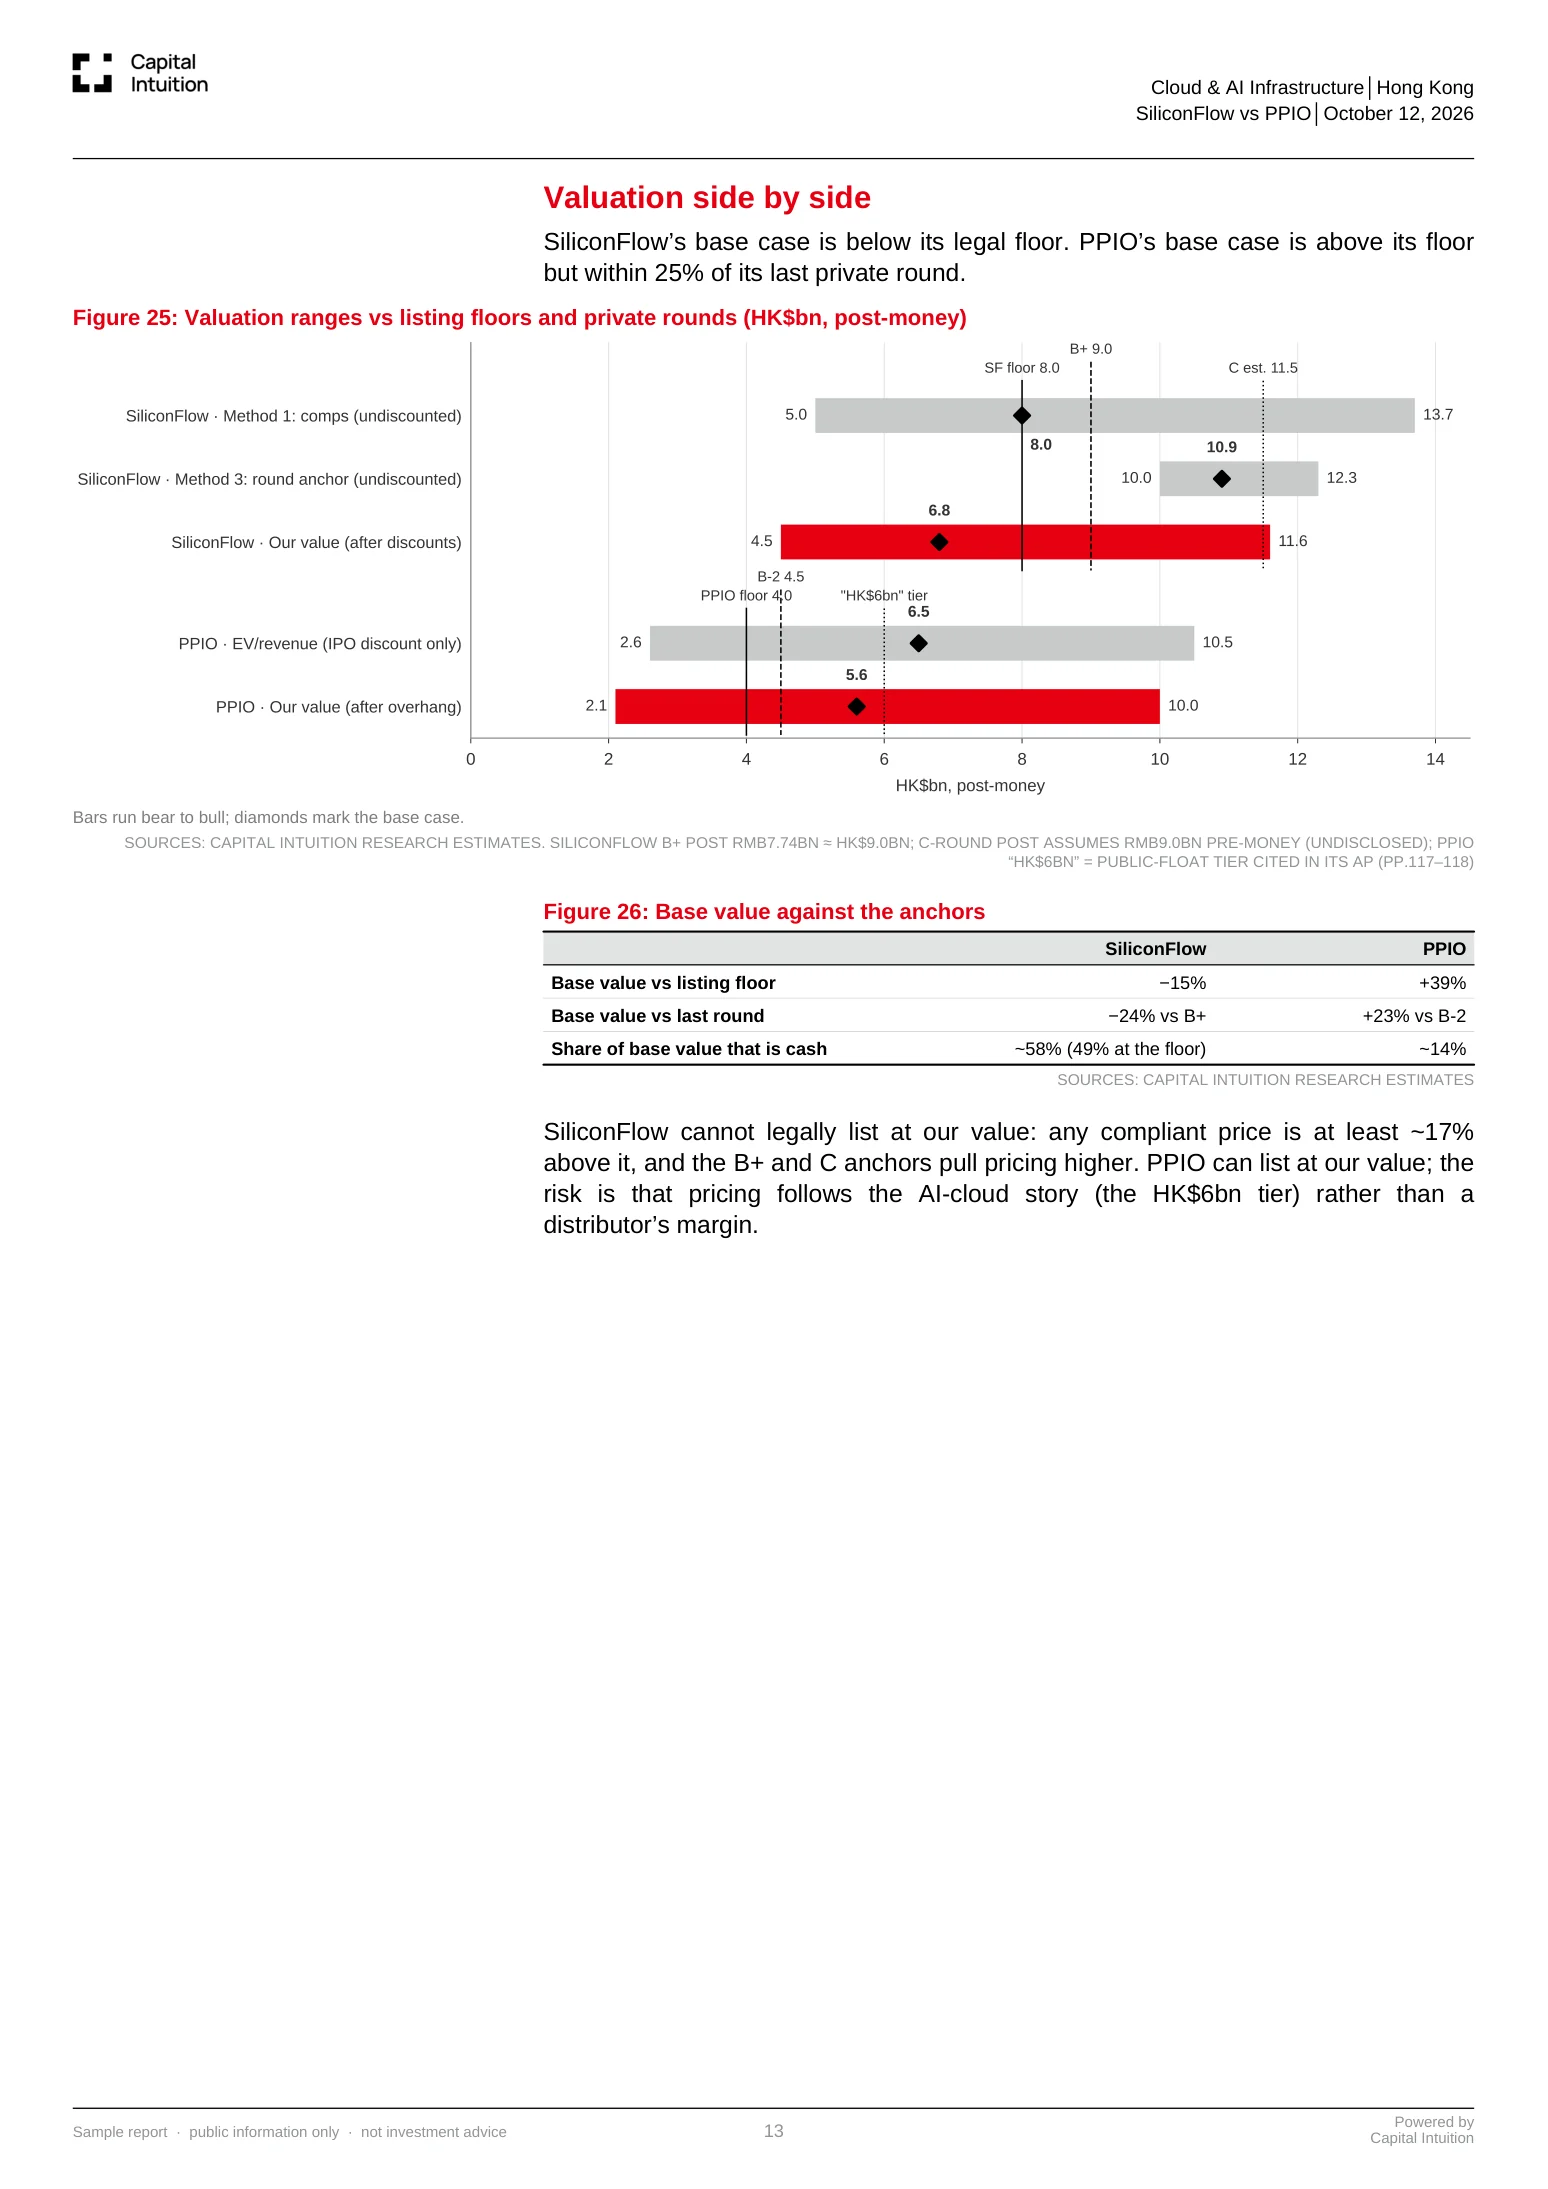
Football fields, sensitivities and charts drawn from the model, footnoted to source, in your house style.
Research memos in
your firm's format
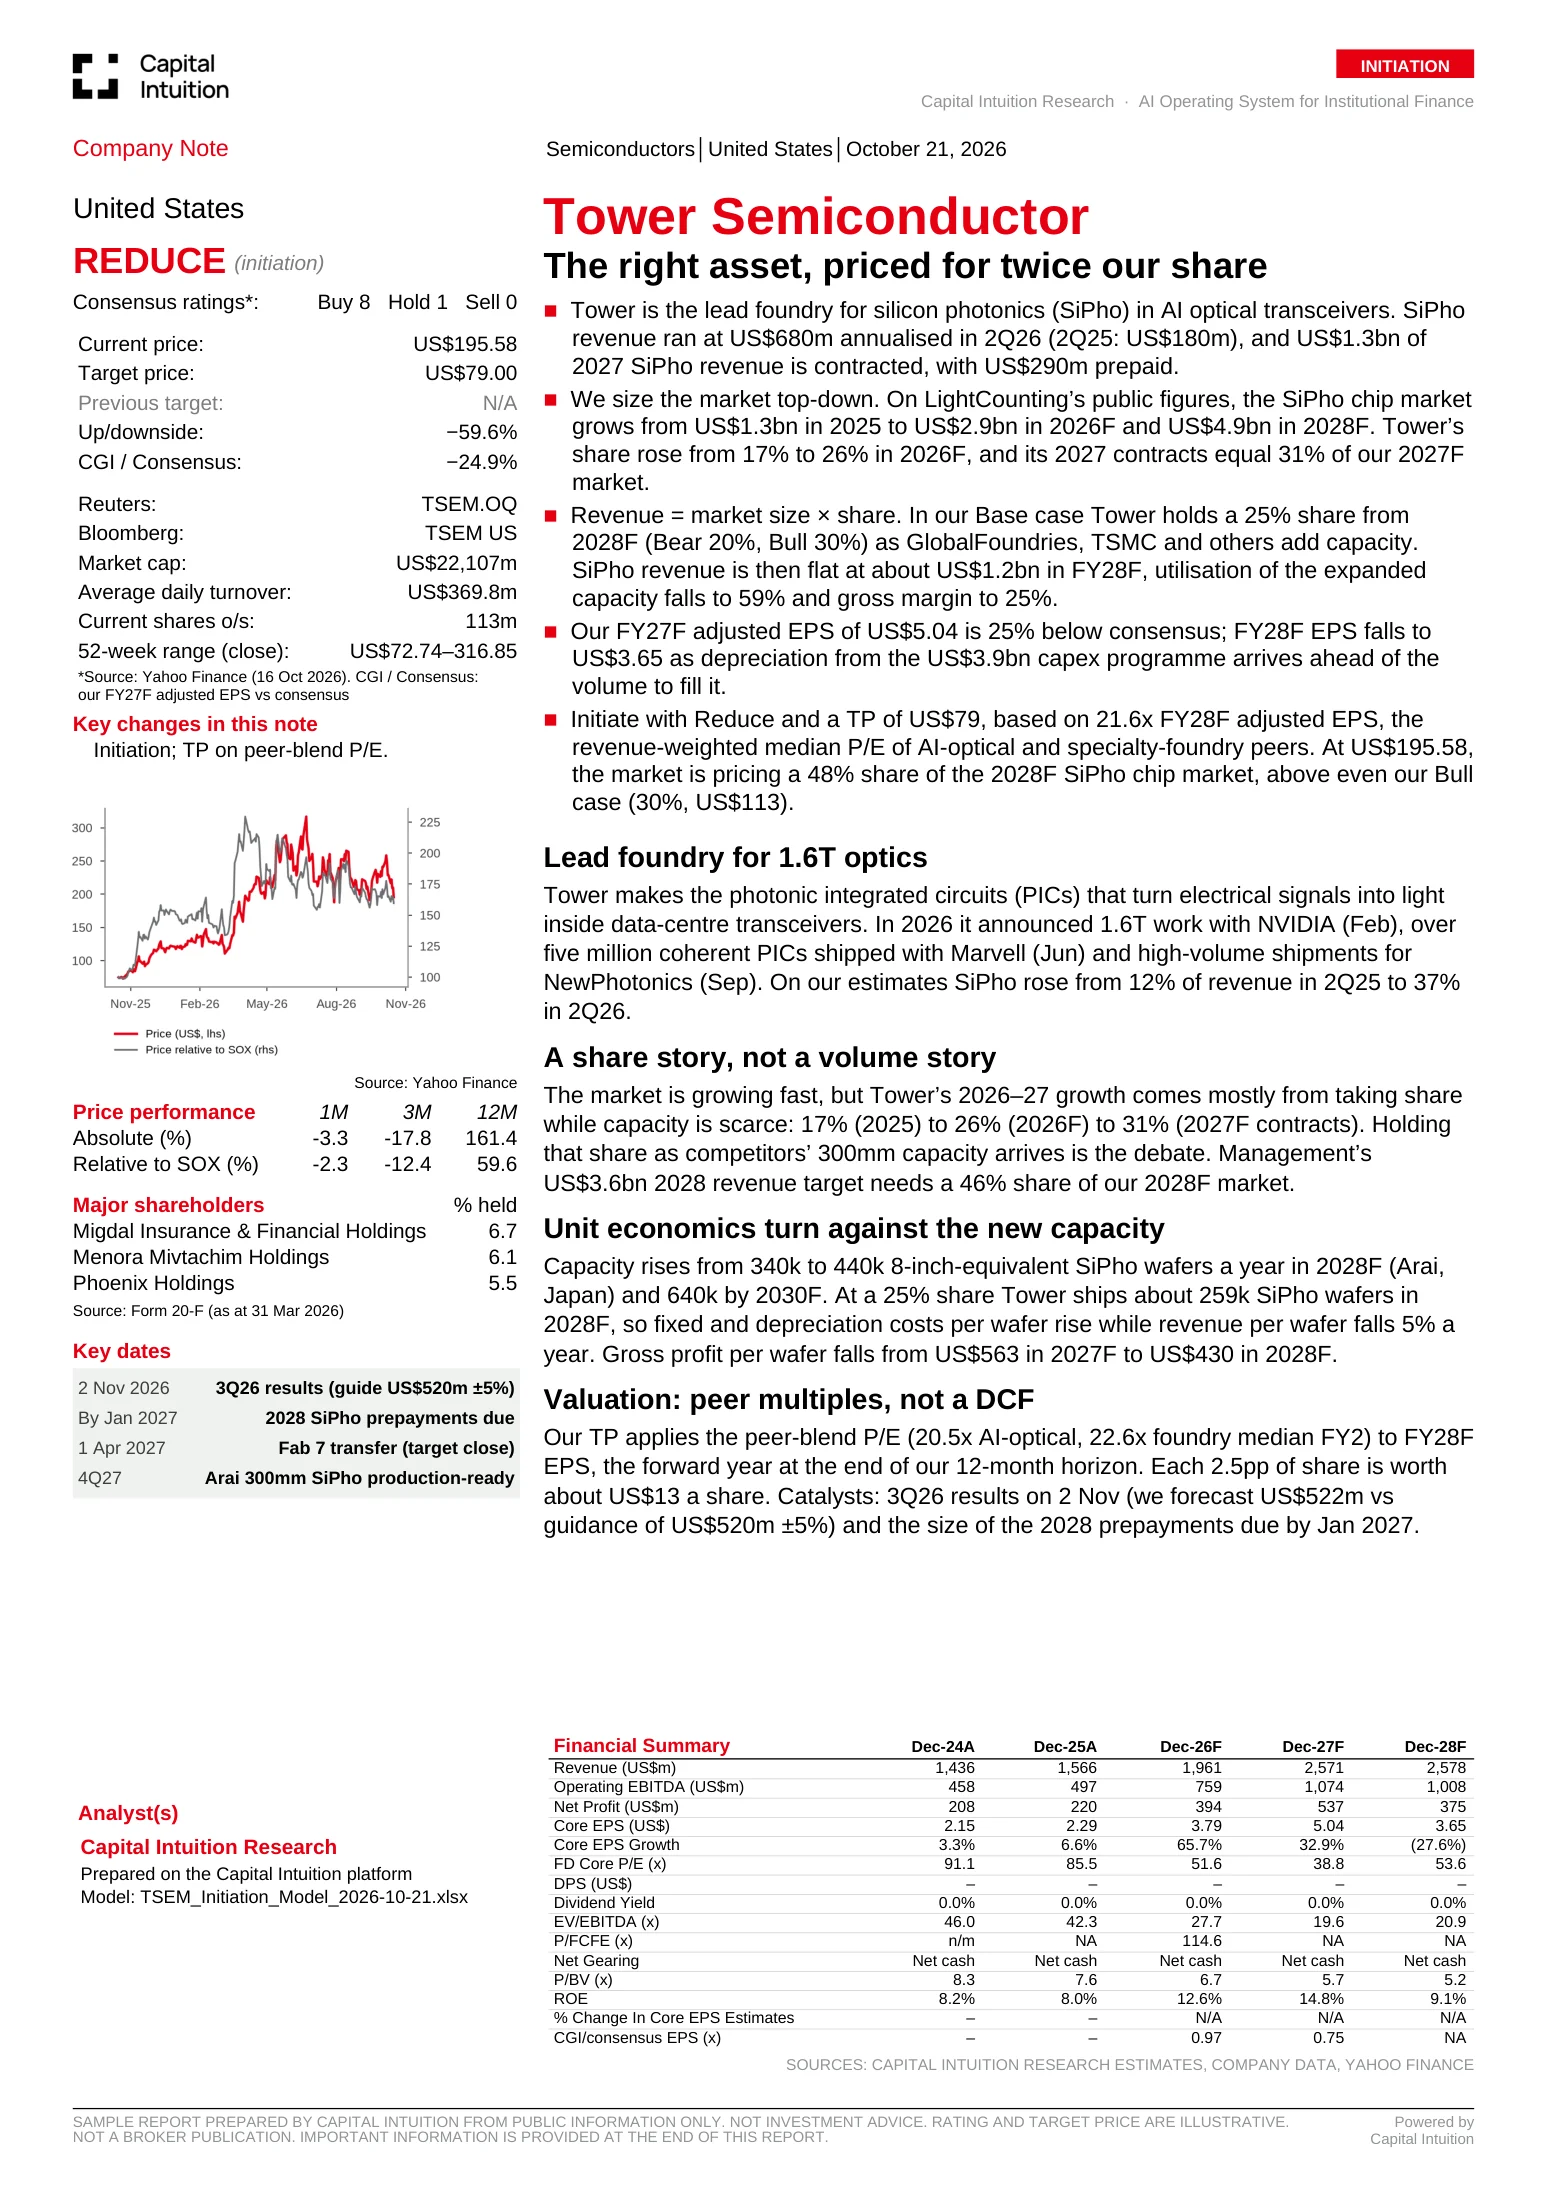
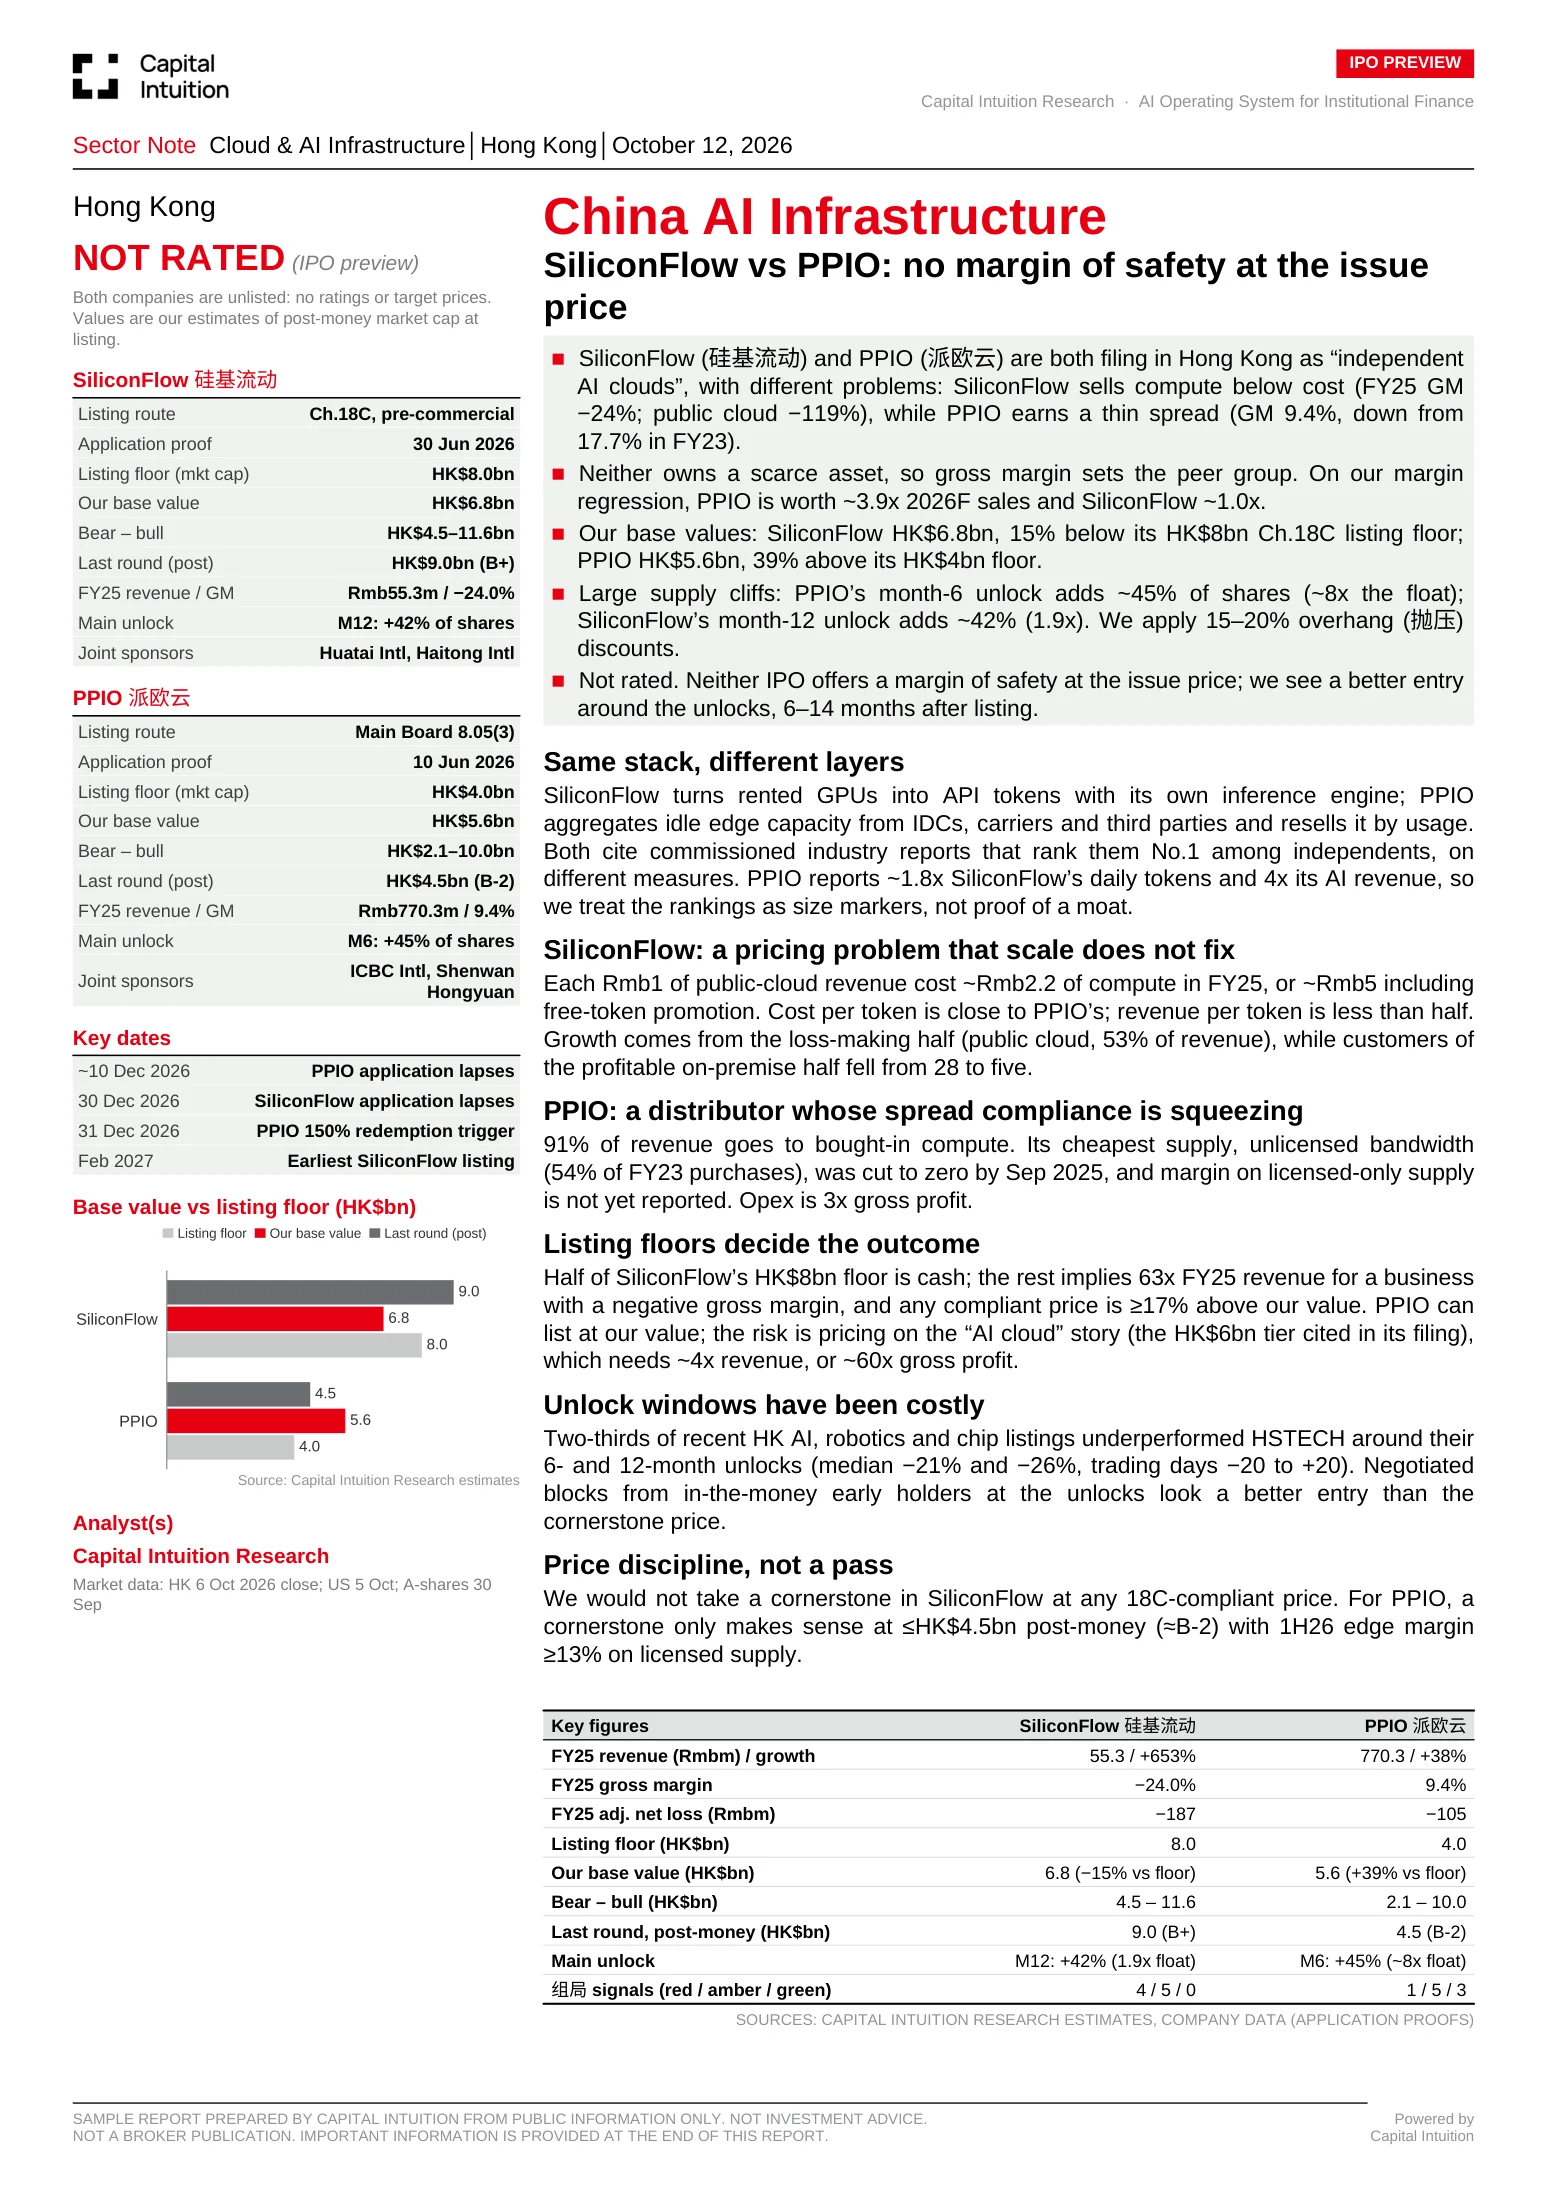
Initiations, sector notes and IPO previews, laid out the way your research desk publishes them.
| B | C | E | F | G | H | I | J | K | L | |
|---|---|---|---|---|---|---|---|---|---|---|
| 1 | Trading comparables | |||||||||
| 2 | LTM multiples at 16 Oct 2026. EV includes lease liabilities; EV / EBITDA as reported (post-IFRS 16 for IFRS reporters). US$ m. | |||||||||
| 3 | Subject: Alpine at entry EV RMB 10,000m = 1.00x sales, 10.0x entry EBITDA (Inputs) | |||||||||
| 4 | ||||||||||
| 5 | Company | Group | Market cap (US$ m) | EV (US$ m) | LTM revenue (US$ m) | Revenue growth (LTM) | EBITDA margin (LTM) | EV / Sales (LTM) | EV / EBITDA (LTM) | LTM to |
| 6 | Alpine at the entry EV on Inputs | Subject | n/a | 1,496 | 1,496 | 7.0% | 10.0% | 1.00x | 10.0x | 2024 |
| 7 | Alpine at the stretch bid (Ability_to_Pay) | Subject | n/a | 1,319 | 1,496 | 7.0% | 10.0% | 0.88x | 8.8x | 2024 |
| 8 | ||||||||||
| 9 | A · China sportswear retail | |||||||||
| 10 | Topsports International (6110 HK) | A | 841 | 1,047 | 3,741 | (4.7%) | 11.7% | 0.28x | 2.4x | Feb '26 |
| 11 | Pou Sheng International (3813 HK) | A | 245 | 143 | 2,491 | (3.9%) | 8.2% | 0.06x | 0.7x | Jun '26 |
| 12 | ||||||||||
| 13 | B · China sportswear brands | |||||||||
| 14 | Anta Sports (2020 HK) | B | 27,777 | 26,960 | 12,530 | 12.6% | 34.9% | 2.15x | 6.2x | Jun '26 |
| 15 | Li Ning (2331 HK) | B | 4,358 | 2,411 | 4,415 | 3.0% | 18.6% | 0.55x | 2.9x | Jun '26 |
| 16 | Xtep International (1368 HK) | B | 1,269 | 1,073 | 2,076 | 0.5% | 15.7% | 0.52x | 3.3x | Jun '26 |
| 17 | 361 Degrees (1361 HK) | B | 1,353 | 883 | 1,580 | 10.6% | 18.4% | 0.56x | 3.0x | Dec '25 |
| 18 | ||||||||||
| 19 | C · Global sporting goods retail | |||||||||
| 20 | Dick's Sporting Goods (DKS US) | C | 13,030 | 20,080 | 21,150 | 53.5% | 10.1% | 0.95x | 9.4x | Aug '26 |
| 21 | Academy Sports + Outdoors (ASO US) | C | 3,660 | 5,330 | 6,190 | 3.7% | 11.4% | 0.86x | 7.5x | Aug '26 |
| 22 | JD Sports Fashion (JD/ LN) | C | 6,014 | 10,548 | 16,829 | 2.1% | 14.7% | 0.63x | 4.3x | Aug '26 |
| 23 | ||||||||||
| 24 | D · Global sportswear brands (reference) | |||||||||
| 25 | Nike (NKE US) | D | 55,790 | 58,550 | 45,890 | (1.2%) | 10.8% | 1.28x | 11.8x | Aug '26 |
| 26 | Adidas (ADS GY) | D | 31,036 | 36,449 | 29,303 | 6.3% | 12.7% | 1.24x | 9.8x | Jun '26 |
| 27 | Amer Sports (AS US) | D | 17,520 | 17,900 | 7,440 | 30.5% | 16.4% | 2.41x | 14.7x | Jun '26 |
| 28 | Puma (PUM GY) | D | 4,017 | 6,583 | 7,866 | (13.1%) | n/m | 0.84x | n/m | Jun '26 |
| B | C | D | E | F | G | H | I | |
|---|---|---|---|---|---|---|---|---|
| 1 | Sensitivities | |||||||
| 2 | Live Excel data tables. The driver cells below feed the model; the tables substitute values into them. Do not overwrite. | |||||||
| 3 | ||||||||
| 87 | IRR, to 60% with company debt: revenue CAGR × year-5 margin | |||||||
| 88 | Revenue CAGR, years 1–5 ↓ · Year-5 EBITDA margin → | |||||||
| 89 | 15.8% | 9.0% | 10.0% | 11.0% | 12.0% | 13.0% | 14.0% | |
| 90 | – | 1.9% | 4.0% | 6.0% | 7.8% | 9.5% | 11.2% | |
| 91 | 3.0% | 4.5% | 6.8% | 8.8% | 10.7% | 12.4% | 15.0% | |
| 92 | 5.0% | 6.3% | 8.6% | 10.7% | 12.7% | 15.5% | 18.1% | |
| 93 | 7.0% | 8.1% | 10.5% | 12.7% | 15.8% | 18.5% | 21.1% | |
| 94 | 9.0% | 10.0% | 12.3% | 15.7% | 18.7% | 21.5% | 24.0% | |
| 95 | 12.0% | 13.0% | 16.8% | 20.1% | 23.1% | 25.8% | 28.3% | |
| 96 | ||||||||
| 97 | ||||||||
| 98 | IRR, to 60%: debt at exercise × cost of debt | |||||||
| 99 | Debt, % of strike EV ↓ · All-in cost of debt → | |||||||
| 100 | 15.8% | 5.5% | 7.0% | 8.0% | 10.0% | |||
| 101 | – | 15.3% | 15.3% | 15.3% | 15.3% | |||
| 102 | 20.0% | 15.7% | 15.6% | 15.5% | 15.4% | |||
| 103 | 30.0% | 15.9% | 15.7% | 15.6% | 15.4% | |||
| 104 | 40.0% | 16.1% | 15.9% | 15.8% | 15.5% | |||
| 105 | 50.0% | 16.3% | 16.1% | 15.9% | 15.5% | |||
| 106 | ||||||||
| 107 | ||||||||
| 108 | IRR, to 60% with company debt: exit year × case | |||||||
| 109 | Exit year ↓ · Case → | |||||||
| 110 | 15.8% | Downside | Base | Upside | ||||
| 111 | 5 | (1.7%) | 15.8% | 33.8% | ||||
| 112 | 6 | (0.7%) | 15.2% | 30.6% | ||||
| 113 | 7 | 0.0% | 14.7% | 28.3% | ||||
| B | C | E | F | G | H | I | J | |
|---|---|---|---|---|---|---|---|---|
| 1 | Company cash and step-up debt | |||||||
| 2 | Debt is raised only if the call is exercised, then repaid from cash flow. RMB m, selected case. | |||||||
| 3 | ||||||||
| 4 | Year | 0 | 1 | 2 | 3 | 4 | 5 | |
| 5 | Fiscal year | FY2026E | FY2027E | FY2028E | FY2029E | FY2030E | FY2031E | |
| 19 | Free cash flow credited | RMB m | 505 | 575 | 652 | 737 | 831 | |
| 20 | Cash interest, after tax shield | RMB m | – | – | – | (302) | (275) | |
| 21 | Cash flow after debt service | RMB m | 505 | 579 | 660 | 448 | 568 | |
| 22 | Debt repaid from cash sweep | RMB m | – | – | – | (448) | (568) | |
| 23 | Ordinary dividends paid | RMB m | – | – | – | – | – | |
| 24 | Debt raised at exercise | RMB m | – | – | – | 5,039 | – | – |
| 25 | Financing fees | RMB m | – | – | – | (101) | – | – |
| 26 | Special dividend to shareholders | RMB m | – | – | – | (4,938) | – | – |
| 27 | Closing cash | RMB m | – | 505 | 1,084 | 1,744 | 1,744 | 1,744 |
| 28 | ||||||||
| 29 | Debt schedule (B) | |||||||
| 30 | Opening debt | RMB m | – | – | – | 5,039 | 4,591 | |
| 31 | Raised at exercise | RMB m | – | – | – | 5,039 | – | – |
| 32 | Interest rolled up (if switched on in Inputs) | RMB m | – | – | – | – | – | |
| 33 | Repaid from cash sweep | RMB m | – | – | – | (448) | (568) | |
| 34 | Closing debt | RMB m | – | – | – | 5,039 | 4,591 | 4,023 |
| 35 | ||||||||
| 36 | Credit statistics (B) | |||||||
| 37 | Interest expense (gross) | RMB m | – | – | – | 403 | 367 | |
| 38 | Net debt | RMB m | – | (505) | (1,084) | 3,294 | 2,847 | 2,278 |
| 39 | Debt / EBITDA after rent | x | – | – | – | 3.7x | 3.0x | 2.4x |
| 40 | Net debt / EBITDA after rent | x | – | – | – | 2.4x | 1.9x | 1.4x |
| 41 | Interest cover (EBITDA after rent / interest) | x | 3.8x | 4.6x | ||||
| A | B | C | D | E | F | G | H | I | |
|---|---|---|---|---|---|---|---|---|---|
| 1 | Lock-up schedule and float impact (selected case, pre-split shares) | ||||||||
| 2 | Tradable H shares: public offer + cornerstone (6 months) + investors (12 months) + founders and platforms (24 months, or earlier) | ||||||||
| 21 | Months from listing | Date | Public offer | Cornerstone | Investor H shares | Founder and platform | Total float | % of total shares | New this month |
| 22 | 0 | Feb-27 | 3,976,889 | – | – | – | 3,976,889 | 11.1% | 3,976,889 |
| 23 | 1 | Mar-27 | 3,976,889 | – | – | – | 3,976,889 | 11.1% | – |
| 24 | 3 | May-27 | 3,976,889 | – | – | – | 3,976,889 | 11.1% | – |
| 25 | 5 | Jul-27 | 3,976,889 | – | – | – | 3,976,889 | 11.1% | – |
| 26 | 6 | Aug-27 | 3,976,889 | 3,976,889 | – | – | 7,953,778 | 22.1% | 3,976,889 |
| 27 | 7 | Sep-27 | 3,976,889 | 3,976,889 | – | – | 7,953,778 | 22.1% | – |
| 28 | 9 | Nov-27 | 3,976,889 | 3,976,889 | – | – | 7,953,778 | 22.1% | – |
| 29 | 11 | Jan-28 | 3,976,889 | 3,976,889 | – | – | 7,953,778 | 22.1% | – |
| 30 | 12 | Feb-28 | 3,976,889 | 3,976,889 | 14,979,369 | – | 22,933,147 | 63.8% | 14,979,369 |
| 31 | 13 | Mar-28 | 3,976,889 | 3,976,889 | 14,979,369 | – | 22,933,147 | 63.8% | – |
| 32 | 15 | May-28 | 3,976,889 | 3,976,889 | 14,979,369 | 6,802,642 | 29,735,789 | 82.7% | 6,802,642 |
| 33 | 18 | Aug-28 | 3,976,889 | 3,976,889 | 14,979,369 | 6,802,642 | 29,735,789 | 82.7% | – |
| 34 | 23 | Jan-29 | 3,976,889 | 3,976,889 | 14,979,369 | 6,802,642 | 29,735,789 | 82.7% | – |
| 35 | 24 | Feb-29 | 3,976,889 | 3,976,889 | 14,979,369 | 6,802,642 | 29,735,789 | 82.7% | – |
| 36 | 25 | Mar-29 | 3,976,889 | 3,976,889 | 14,979,369 | 6,802,642 | 29,735,789 | 82.7% | – |
| 37 | |||||||||
| 38 | Key impact metrics | ||||||||
| 39 | Day-one float, % of shares | 11.1% | |||||||
| 40 | Float after month 6 (cornerstone) | 22.1% | |||||||
| 41 | 12-month unlock: new / prior float | 1.88x | |||||||
| 42 | 12-month unlock, % of shares | 41.7% | |||||||
| 43 | 12-month unlock: days to absorb | 50.9 | Trading days, at the assumed selling ratio and pre-unlock daily turnover | ||||||
| 44 | Founder unlock, % of shares | 18.9% | |||||||
| 45 | Float after 24 months, % of shares | 82.7% | |||||||
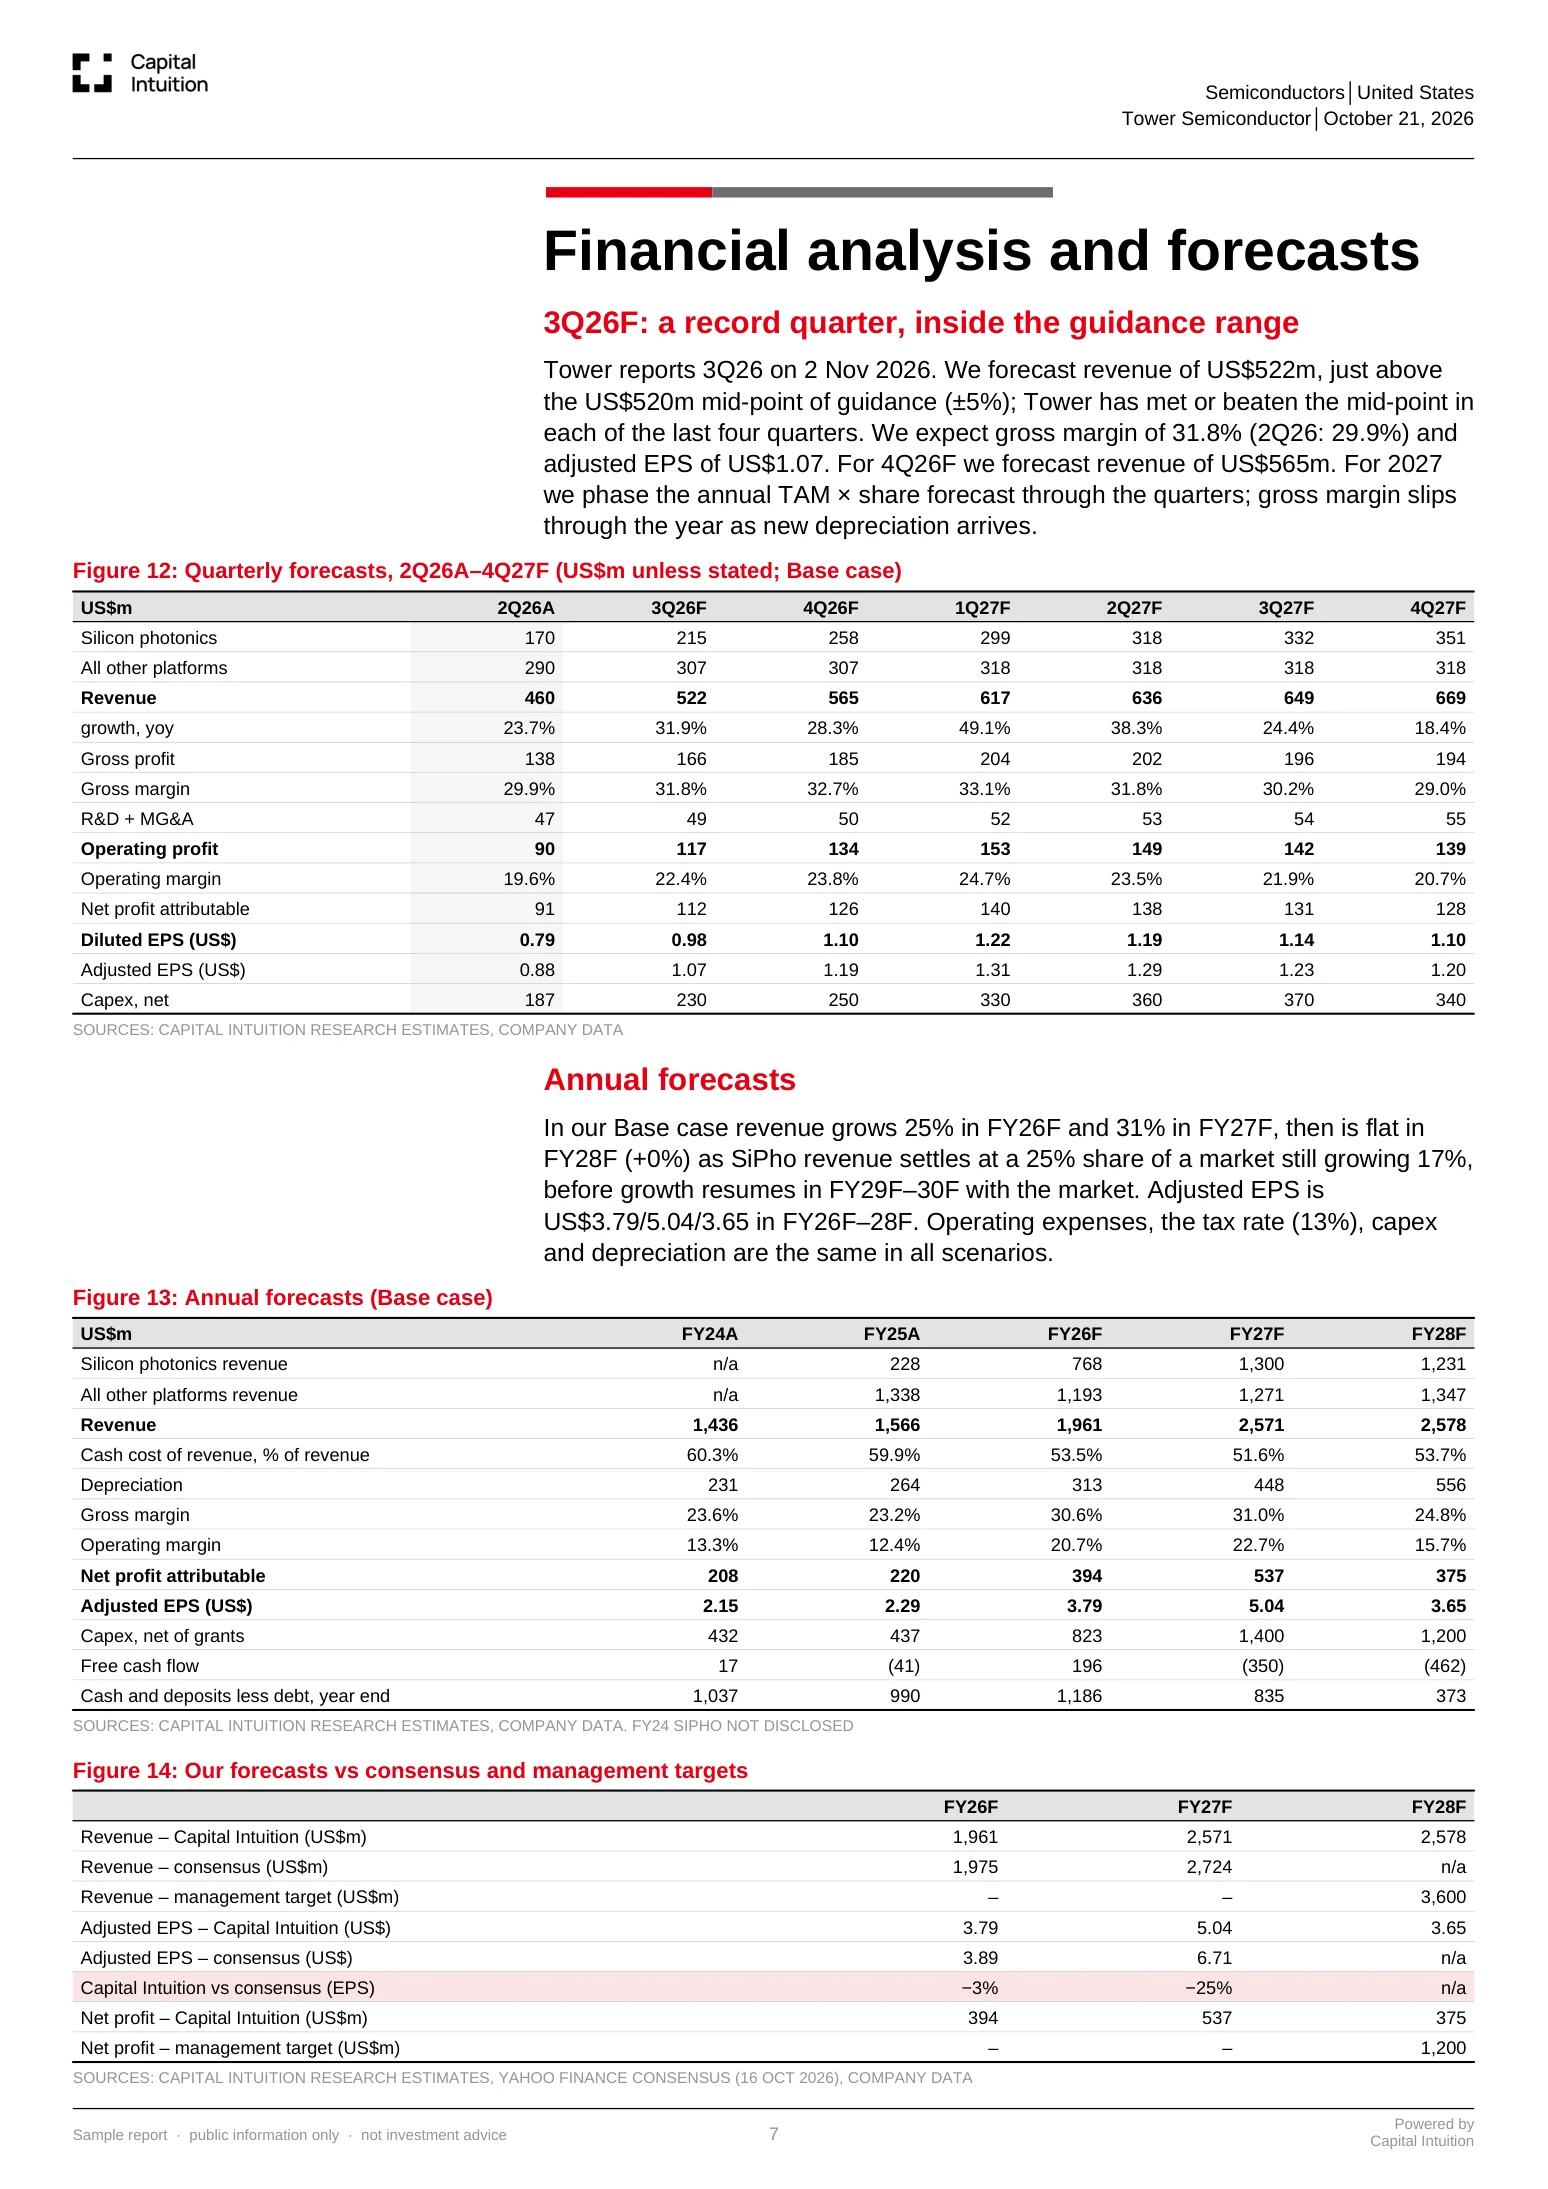
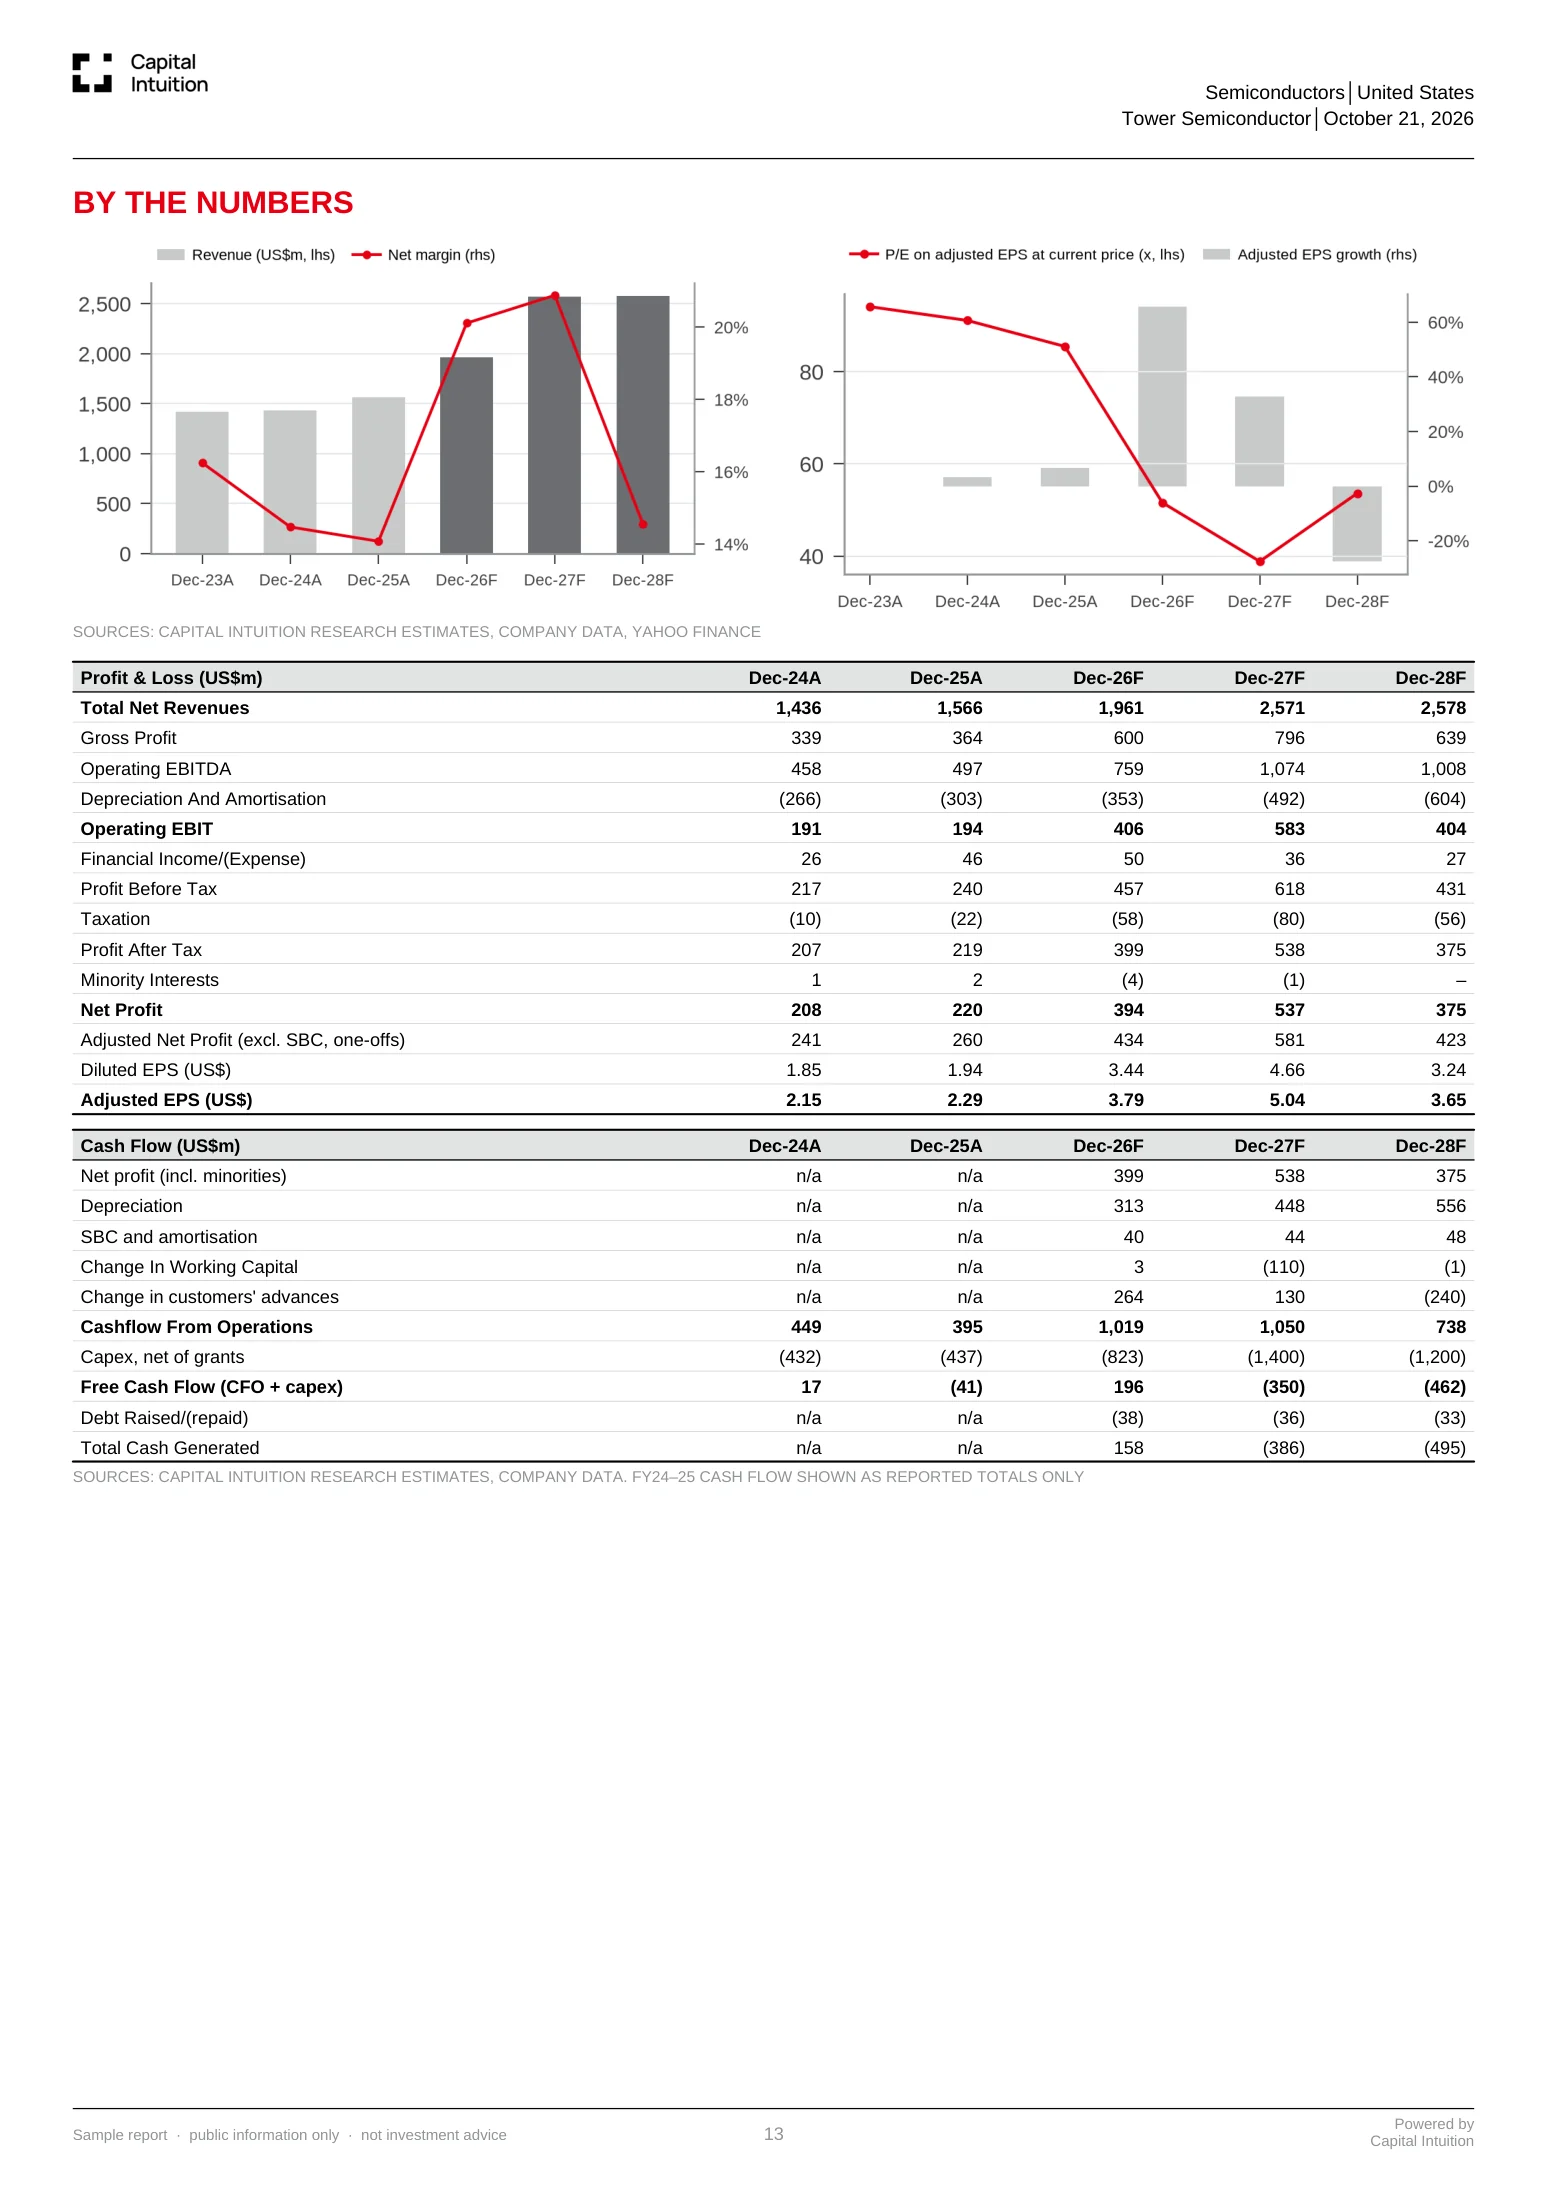
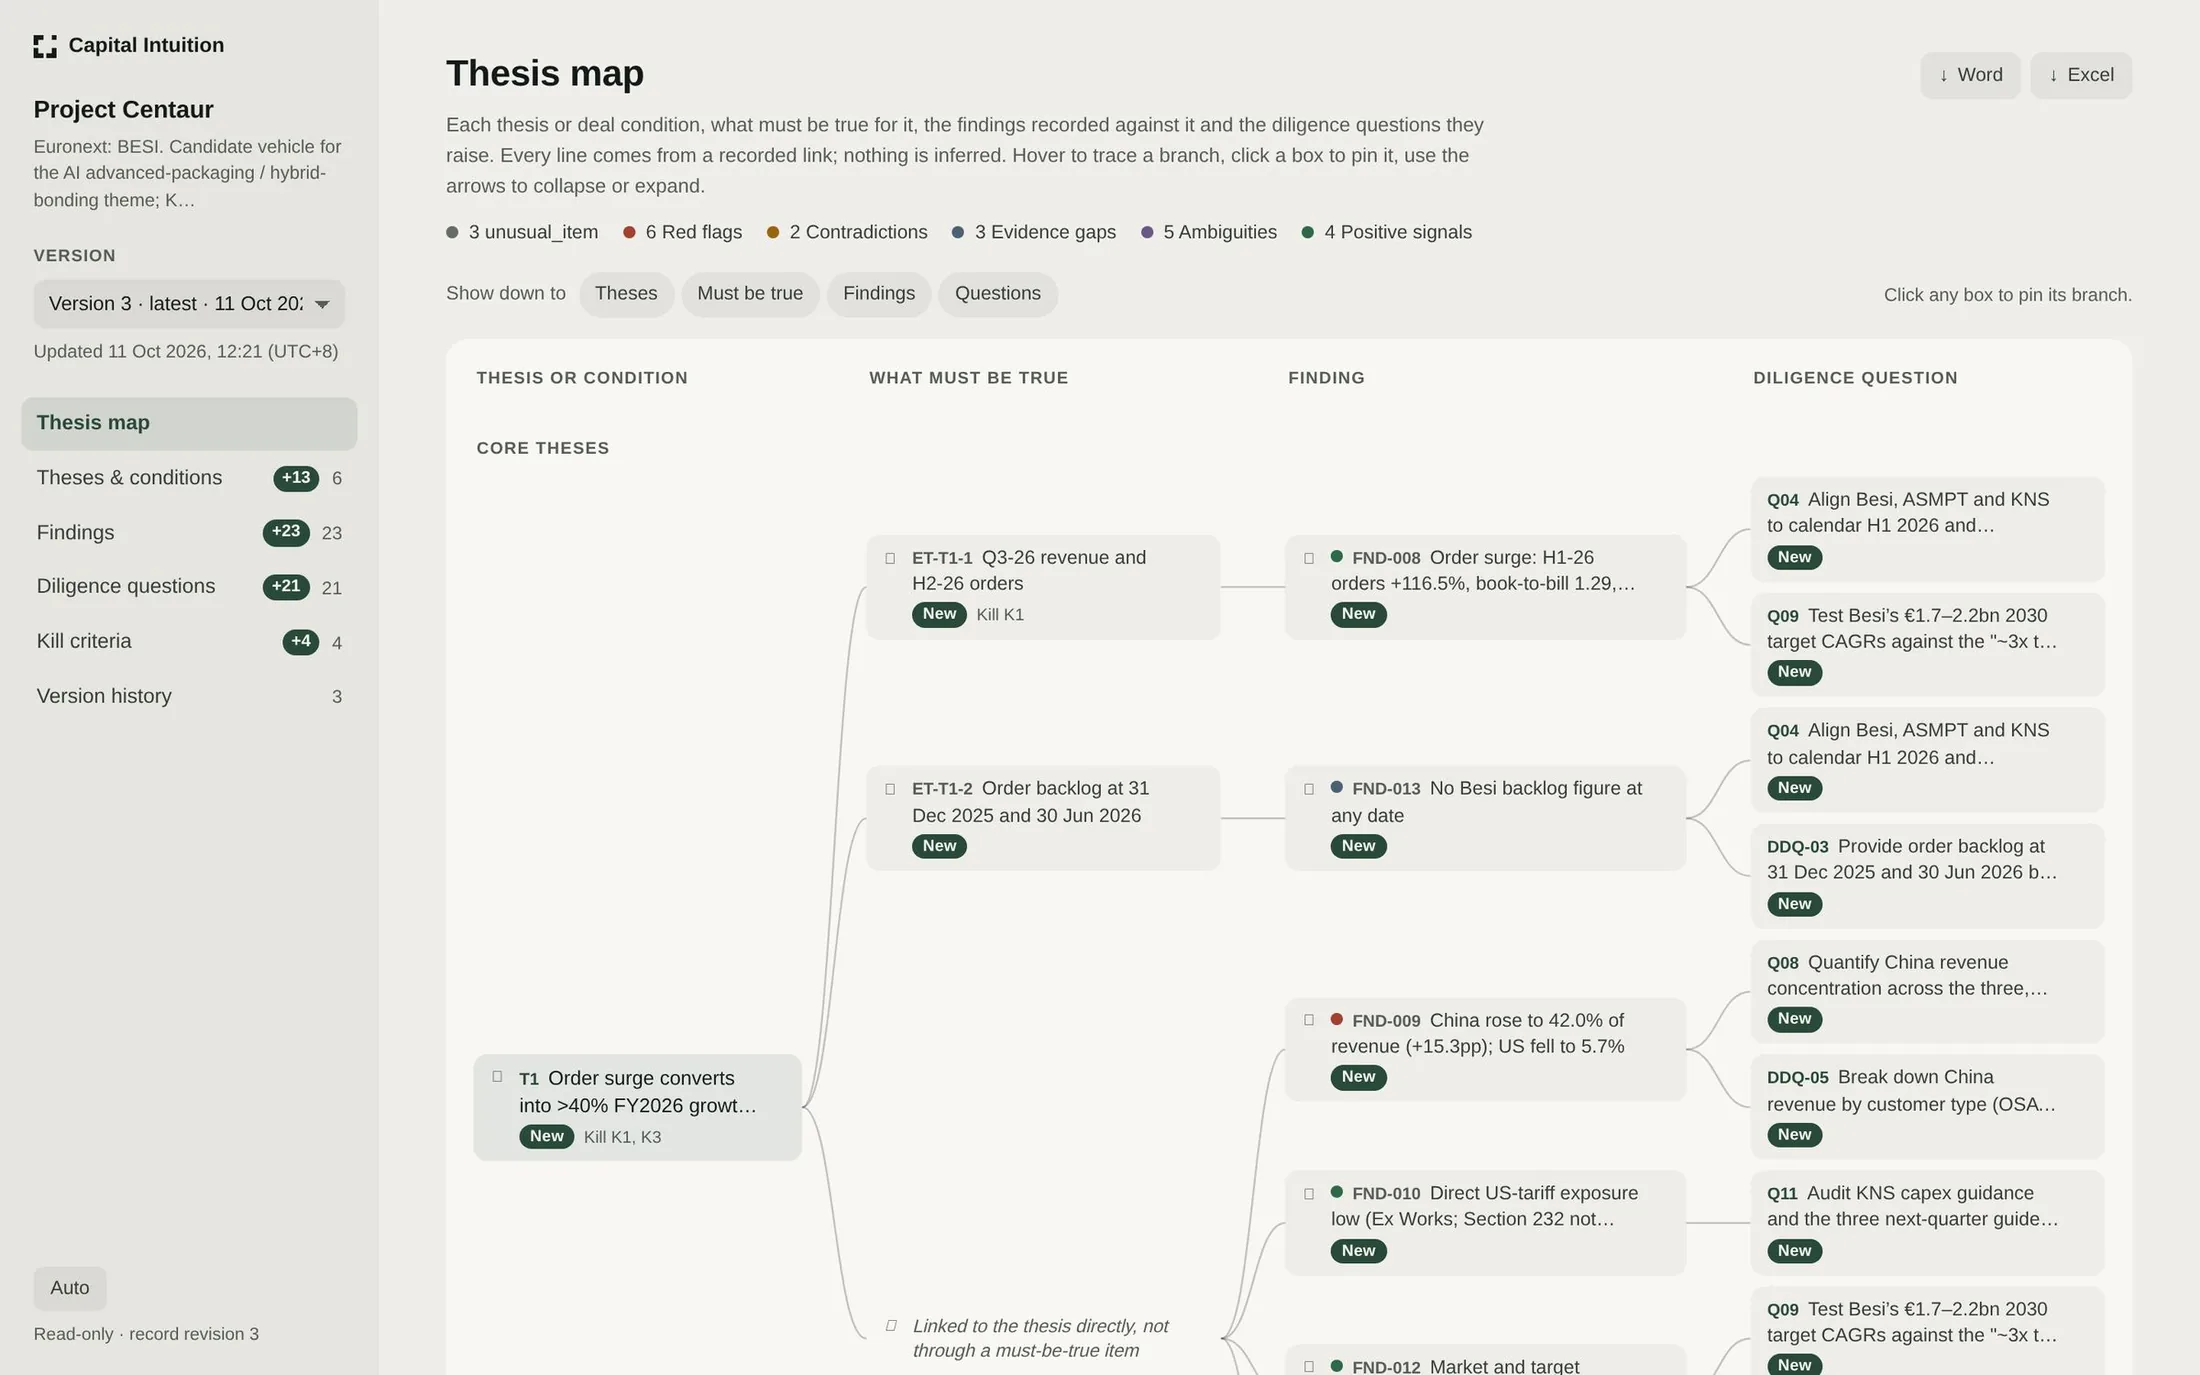
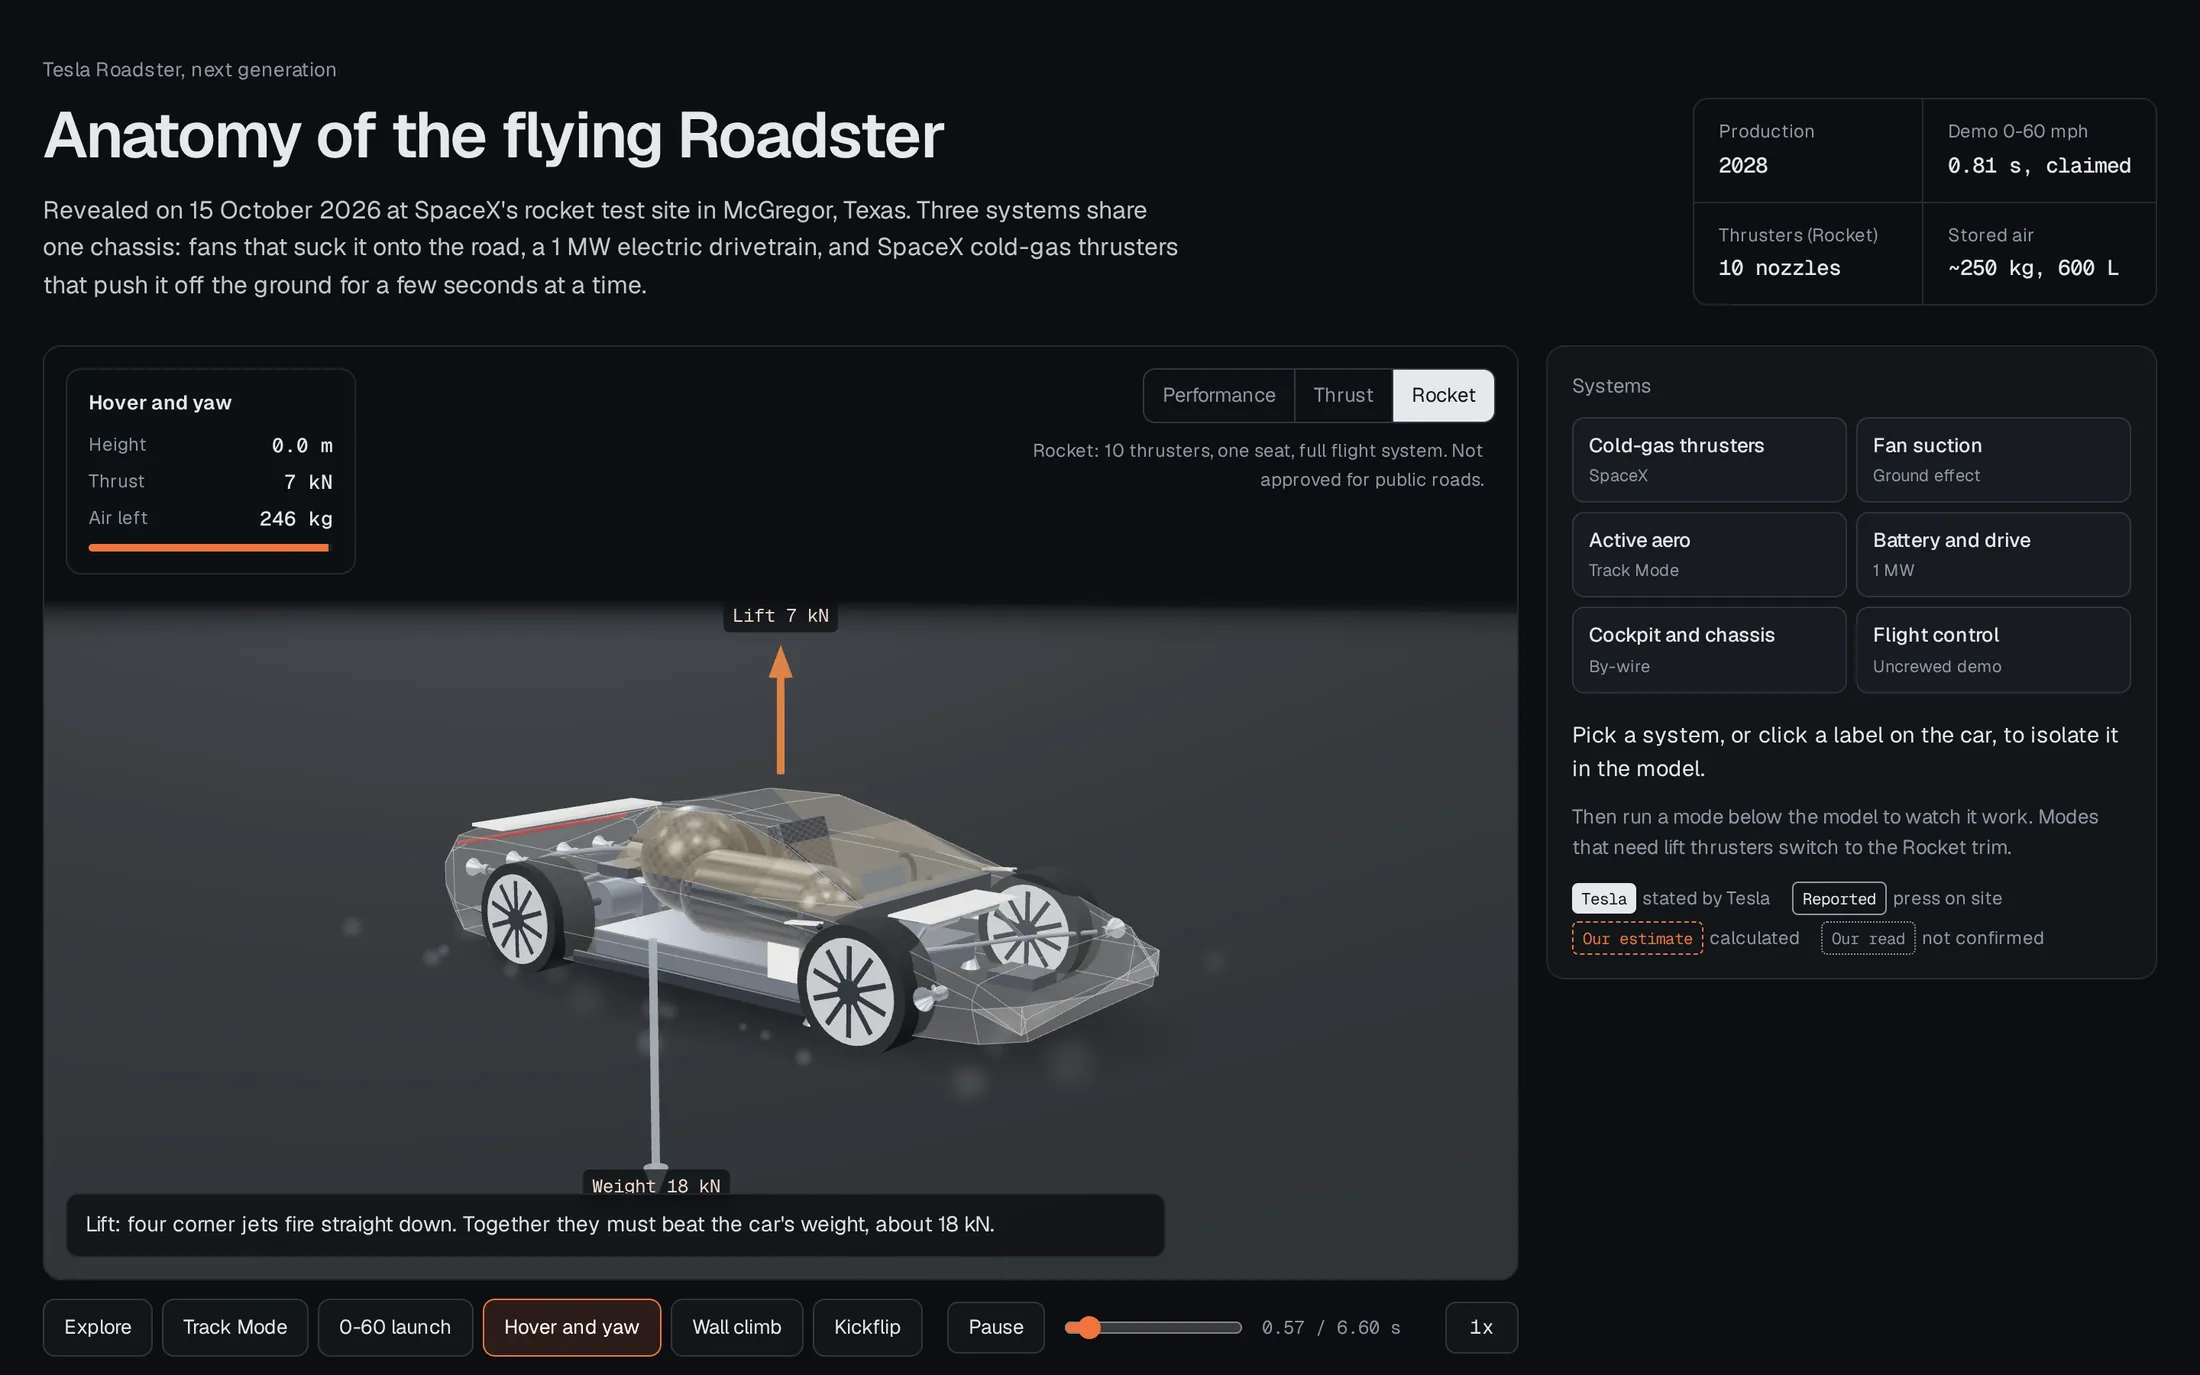
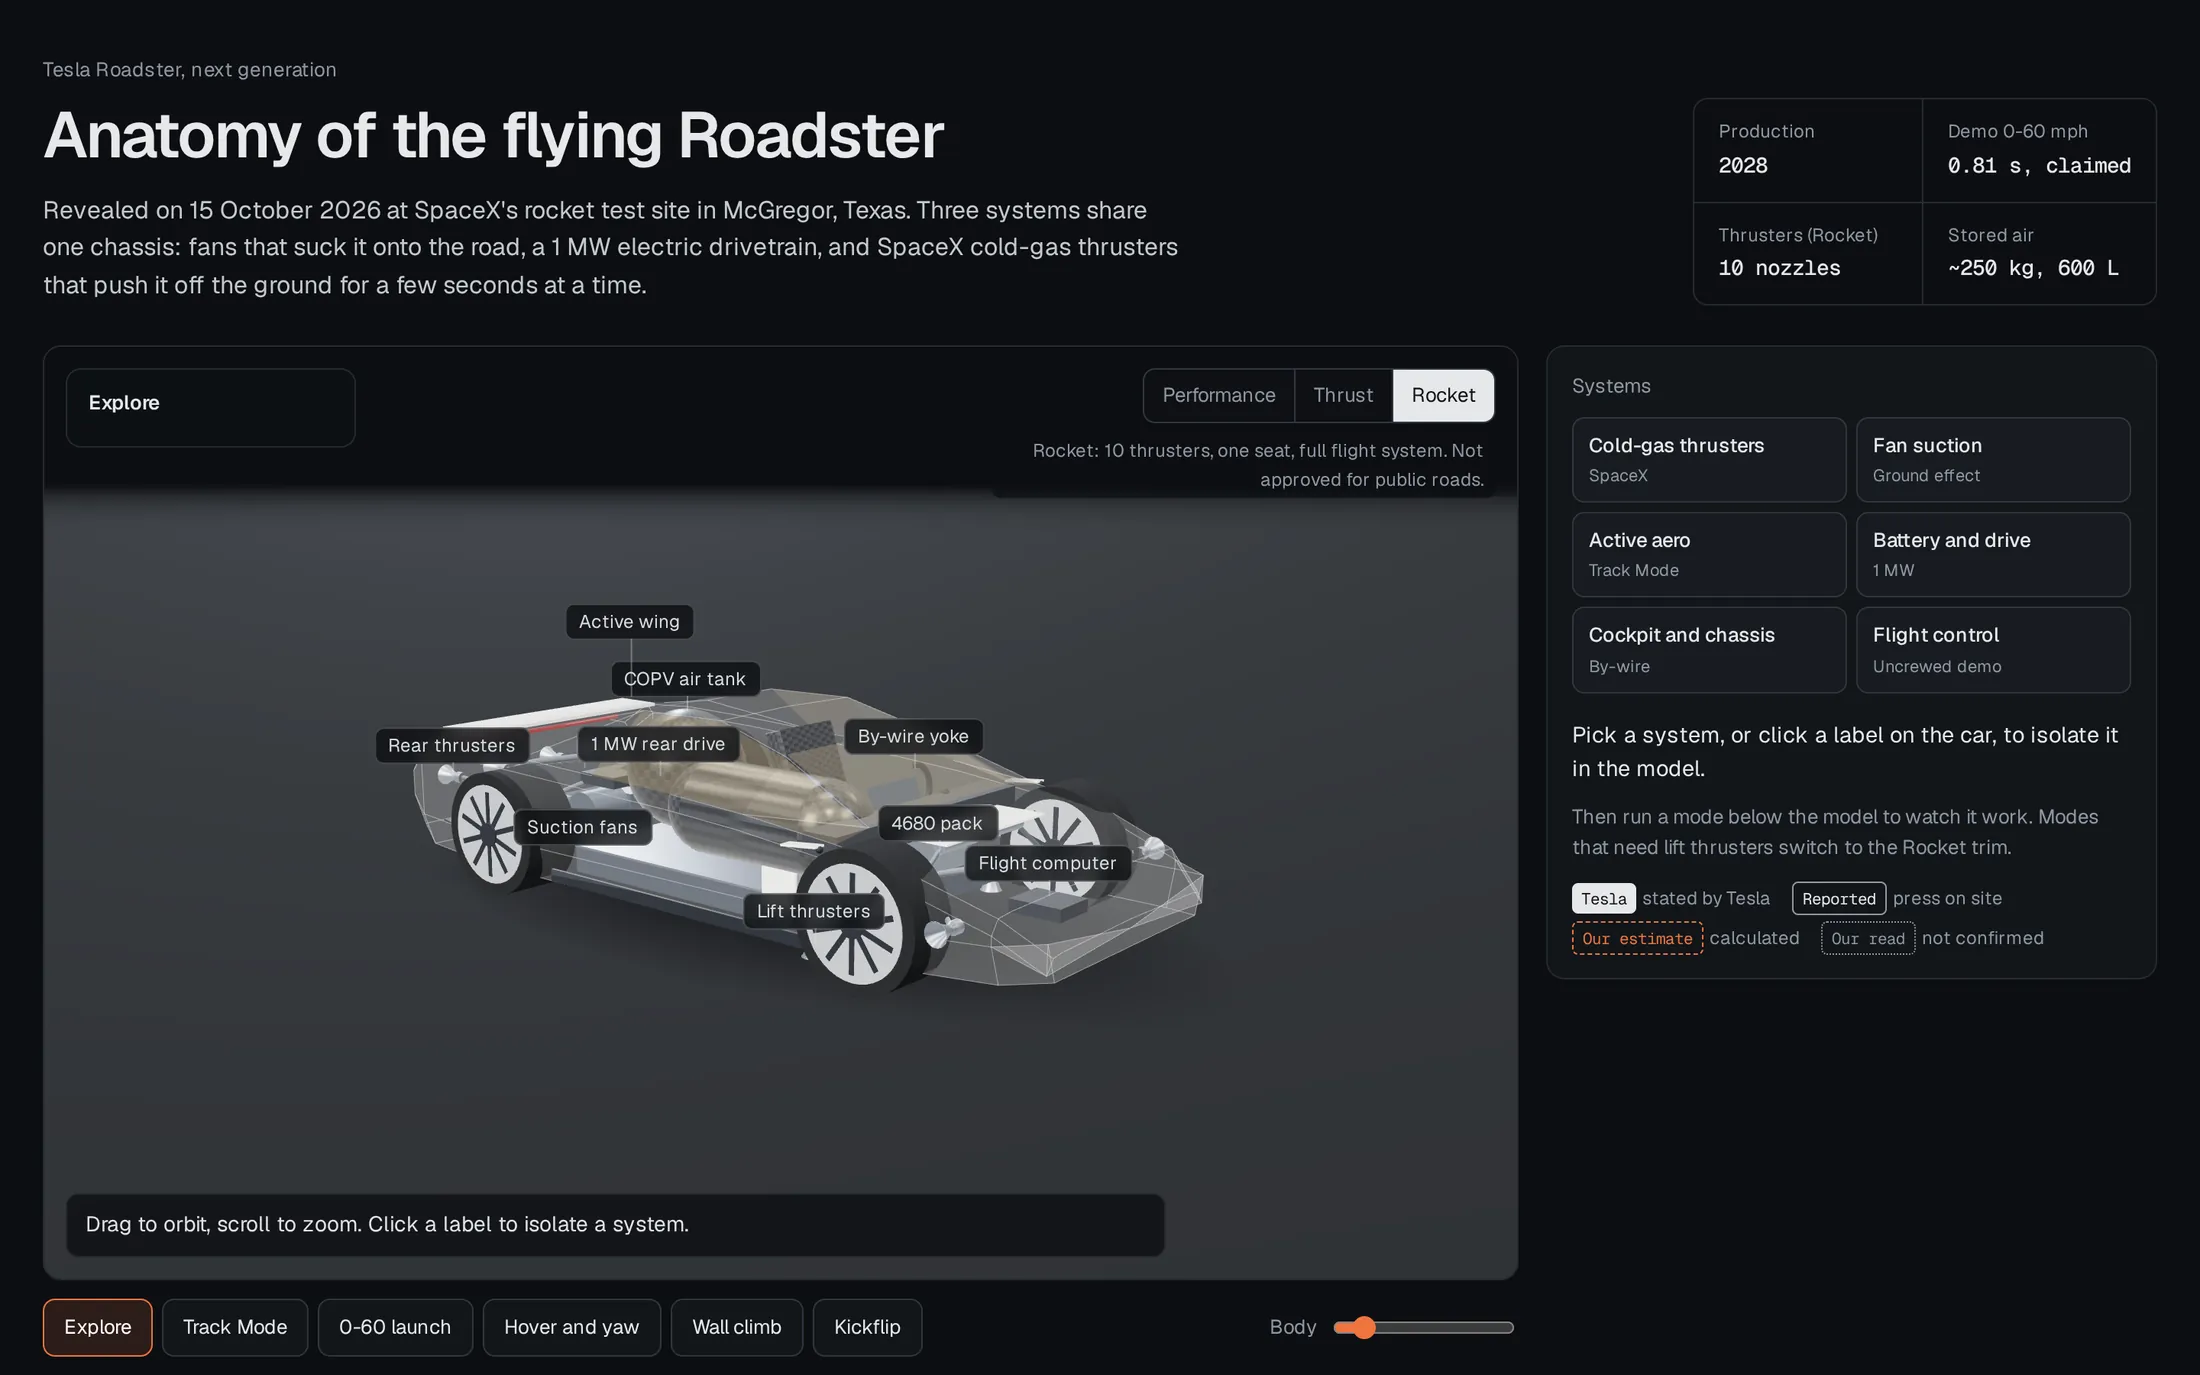
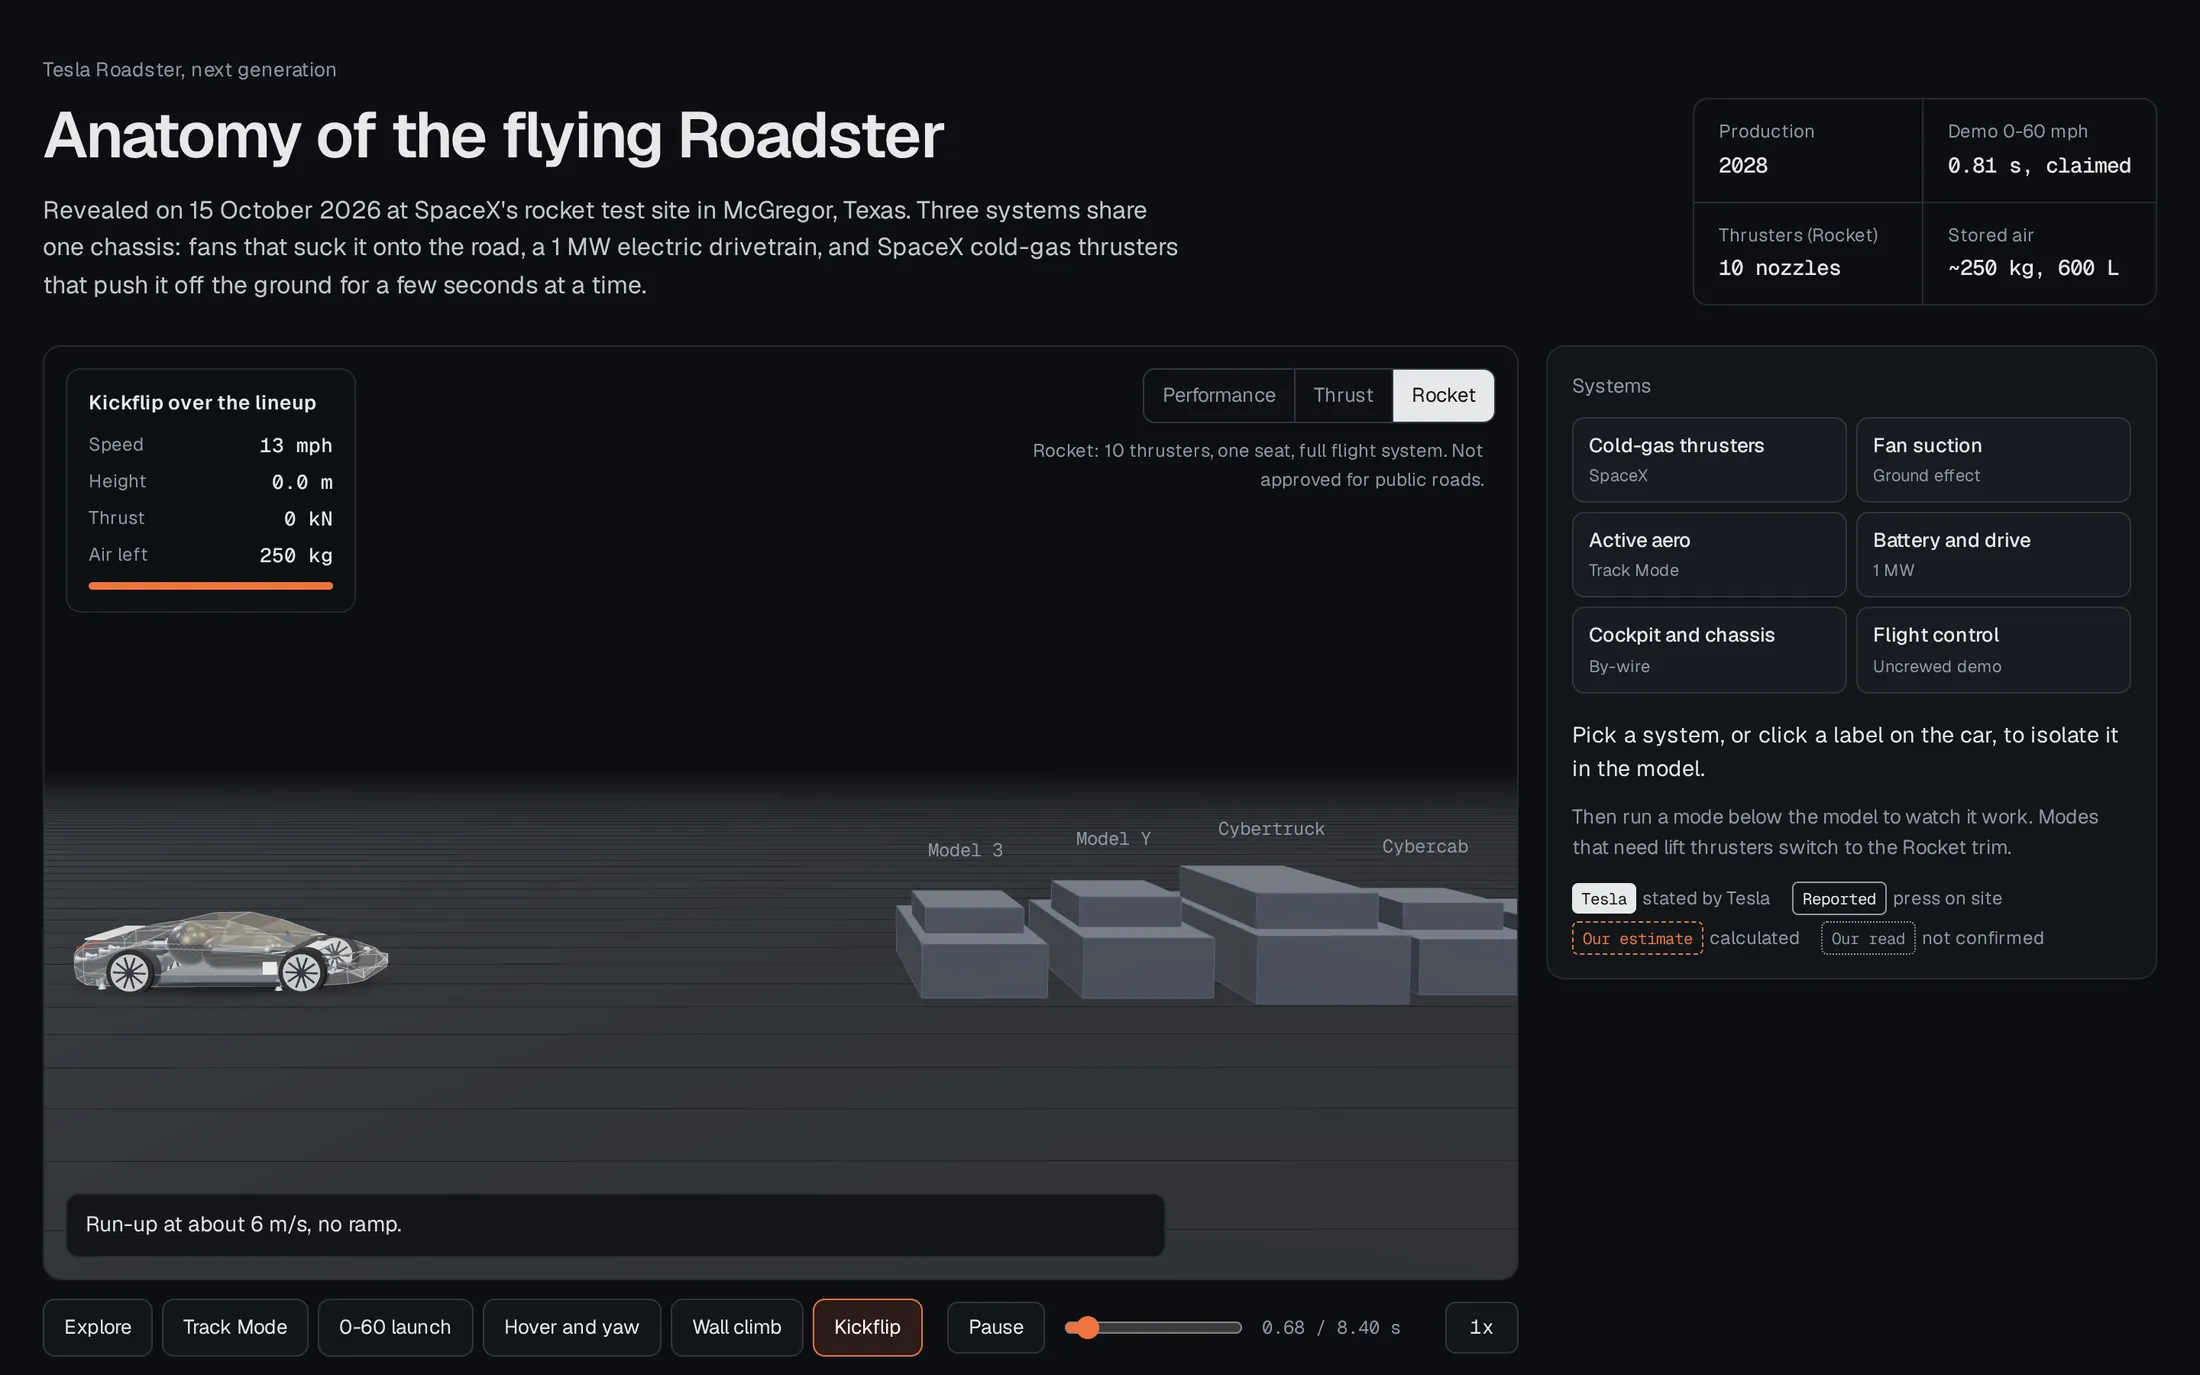
Every deal gets its own tools.
Ask in plain language. Capital Intuition reads the project's files and models, builds the app inside the project and publishes it to your team. It runs on fresh data, and you can share a read-only view with LPs and clients.
Every firm gets its own cloud. It remembers, and it compounds.
Each client runs in an isolated cell with its own database, storage, secrets and agent computers. Projects, memory, skills and apps build up there, so new work starts from everything your firm has done.